Documentation Index
Fetch the complete documentation index at: https://docs.drdroid.io/llms.txt
Use this file to discover all available pages before exploring further.
23rd May 2025
Enhanced Alert Investigation Panel
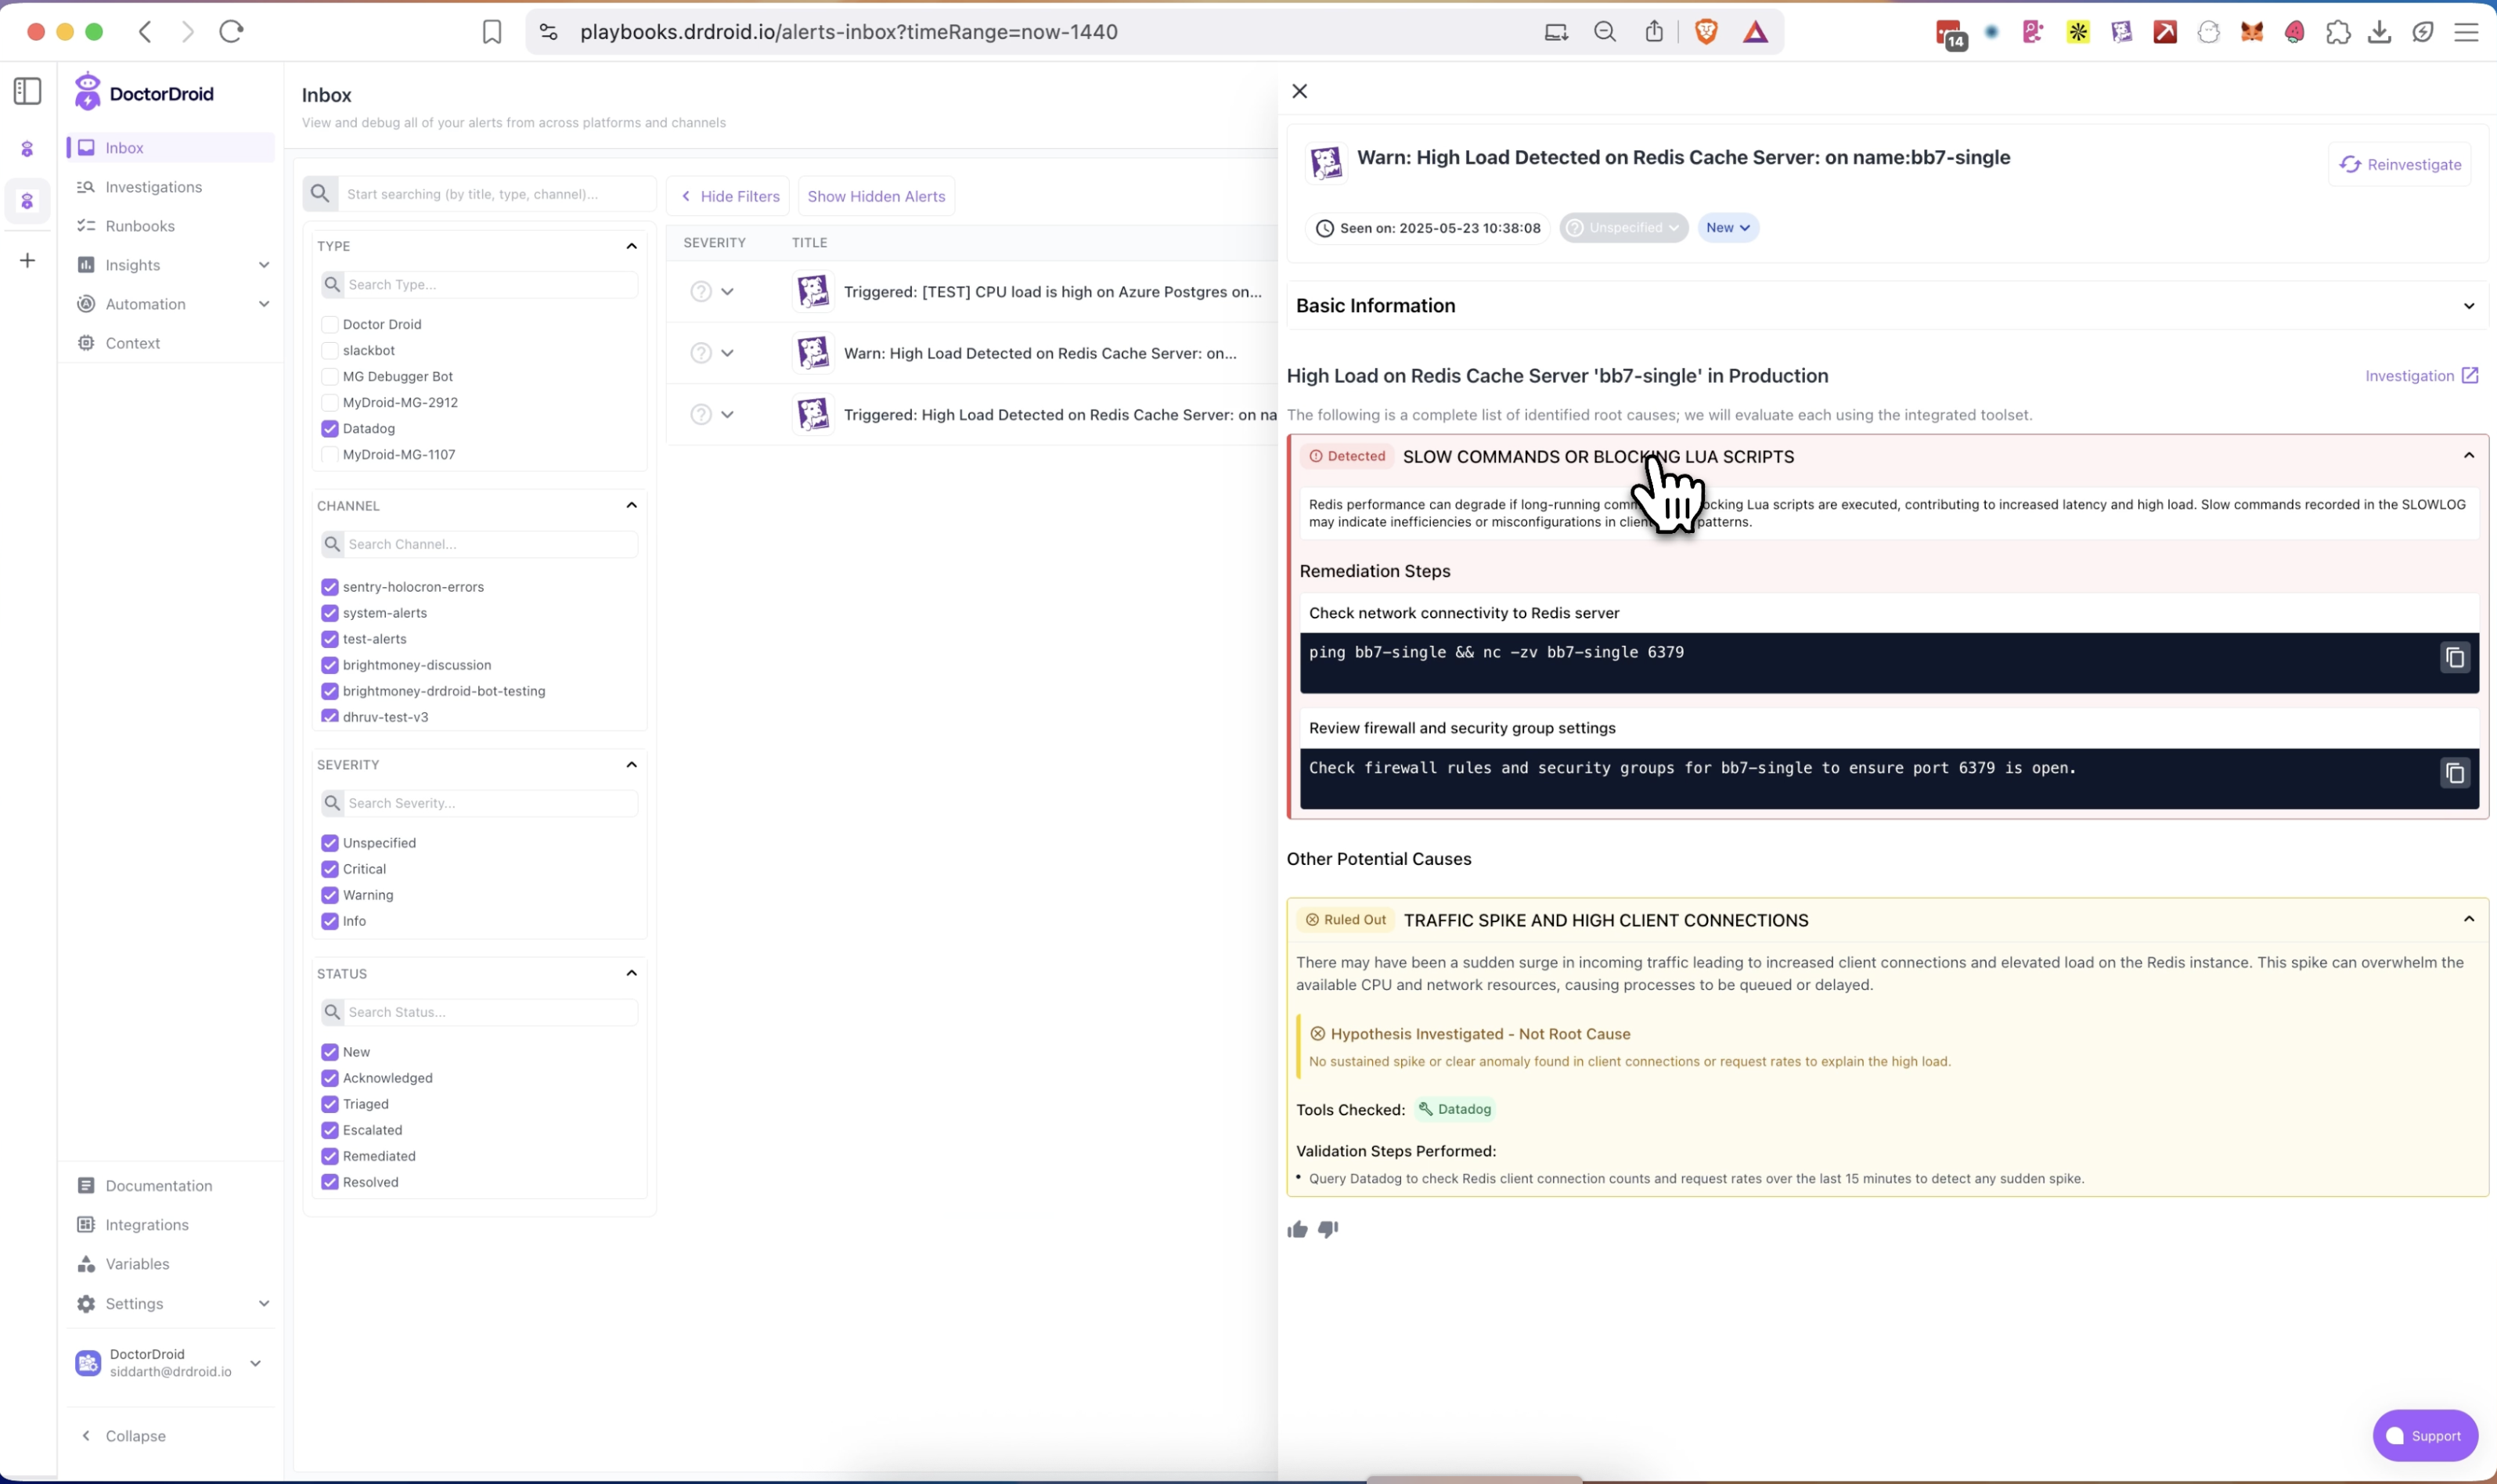
🧠 Hypothesis Visibility:
Get instant visibility into the potential root cause hypotheses auto-generated by the DrDroid AI Agent for any alert — right in the expanded side panel.🔍 Tool Usage Transparency:
Whenever DrDroid accesses your integrated tools (e.g., Datadog, Prometheus) for data validation, it’s now clearly displayed to you along with the relevant steps performed.20th May 2025
Context Engine:
- Service Catalog Auto-Mapping: Automatically pulls data from APMs, Kubernetes clusters, and CI/CD pipelines to build your service inventory.
- Infrastructure Catalog Integration: Syncs with your cloud provider to generate a real-time infrastructure map.
- Tooling Detection: Infers observability and alerting tools from incoming alert streams — no manual config required.
10th May 2025
Onboarding Upgrades
New Signup Flow & Org Setup
Better onboarding, 1-click Slack integration, and responsive experience for new users.
Categorisation on Integrations Page
Integrations are now categorized for better discoverability and can be installed more seamlessly.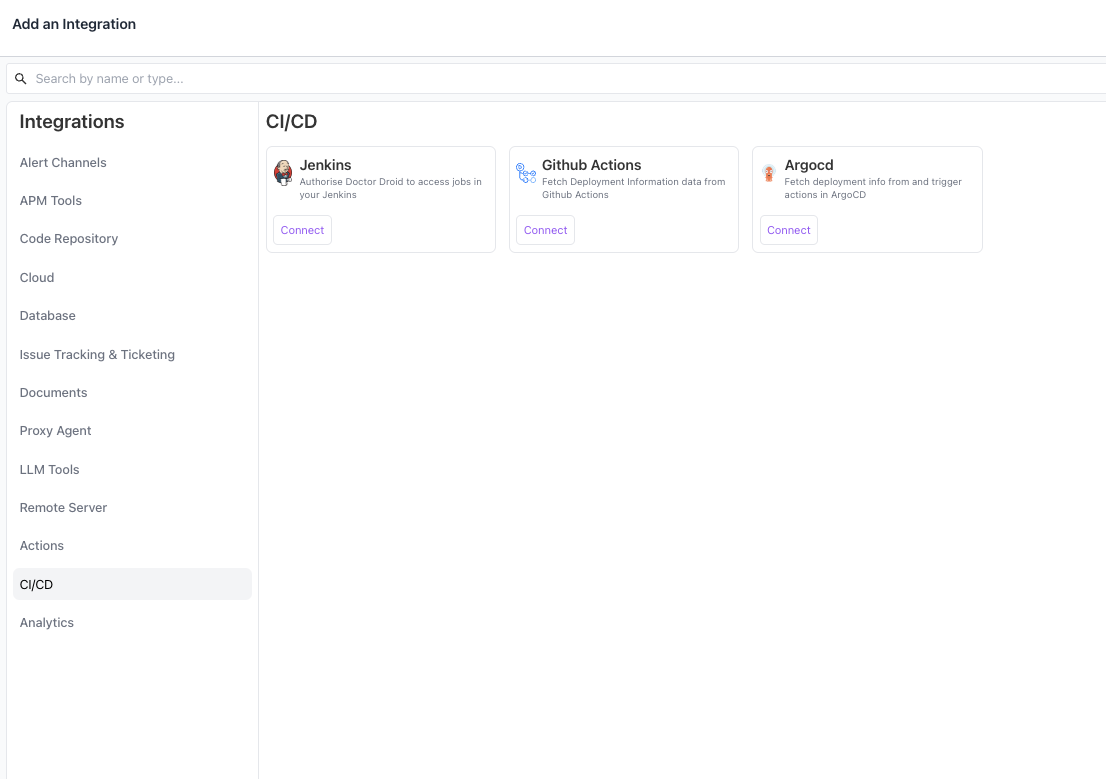
Smarter Agent Investigations with Adaptive Time Ranges
The DrDroid Agent is now more intelligent—automatically selecting the most relevant time duration for investigations based on context.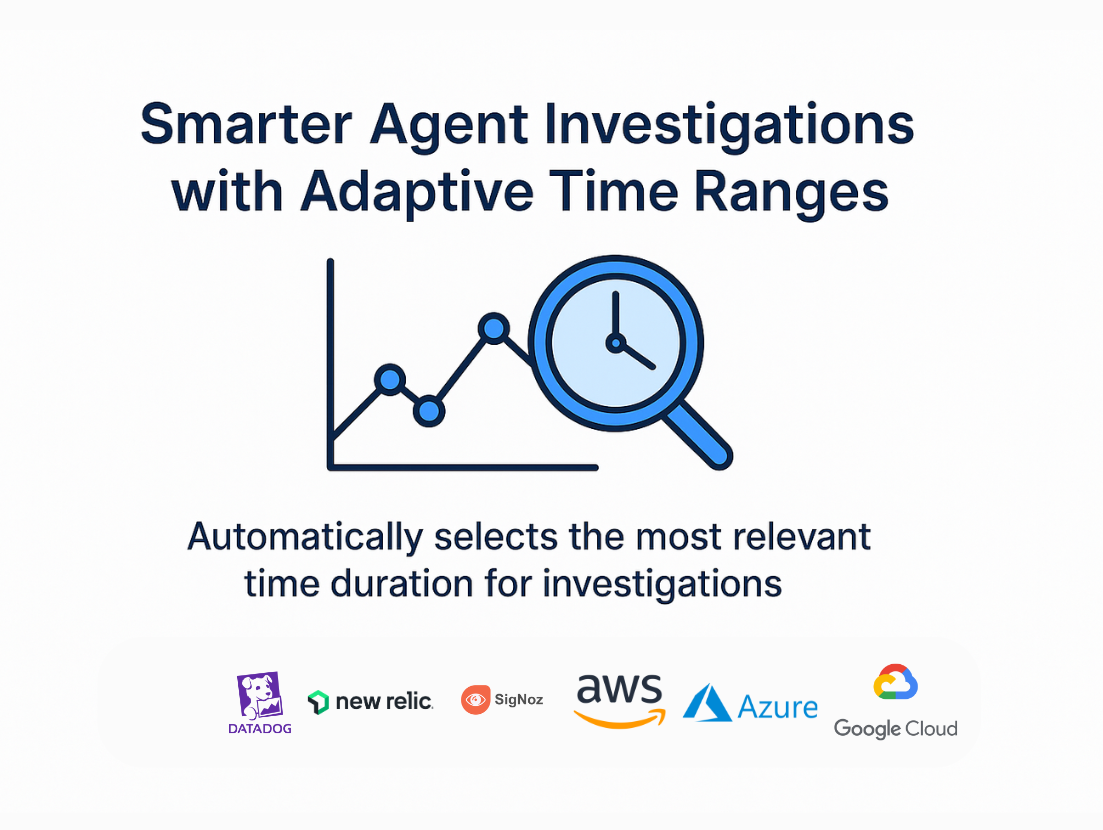
- AWS
- Azure
- GCP
- Datadog
- New Relic
- Signoz
VPC agent Upgrades
🚀 Updates to the VPC Agent
Context: DrDroid’s VPC agent enables you to securely integrate tools inside your VPC to DrDroid cloud — no changes to security groups or ingress policies required.With the latest update to the drd-vpc-agent, we’re making deployments faster and smarter.⚡ One Command Setup for Docker & Helm
You can now install or update the VPC Agent using a single command, directly from your machine.For Docker:🛠️ Helm-Specific Enhancements
✅ Automatic Kubernetes Integration
When installed via Helm, the agent automatically registers a Kubernetes connector for the cluster it’s deployed in.- The agent gains read-only access to the cluster. It can start fetching cluster metrics immediately—no manual setup needed.
🔄 Daily Auto-Upgrades
The VPC Agent now supports auto-updates of the agent image every day at 00:00 UTC.- Default deployment namespace:
drdroid - To customize, simply update the
namespaceinhelm/deploy_helm.sh
7th May 2025
Alerts Inbox v0 – Initial Release
Prefer watching? There’s a demo video at the end.Unified Alert View
All your alerts from multiple sources are now visible in one consolidated screen — searchable and filterable by time, channel, or tool.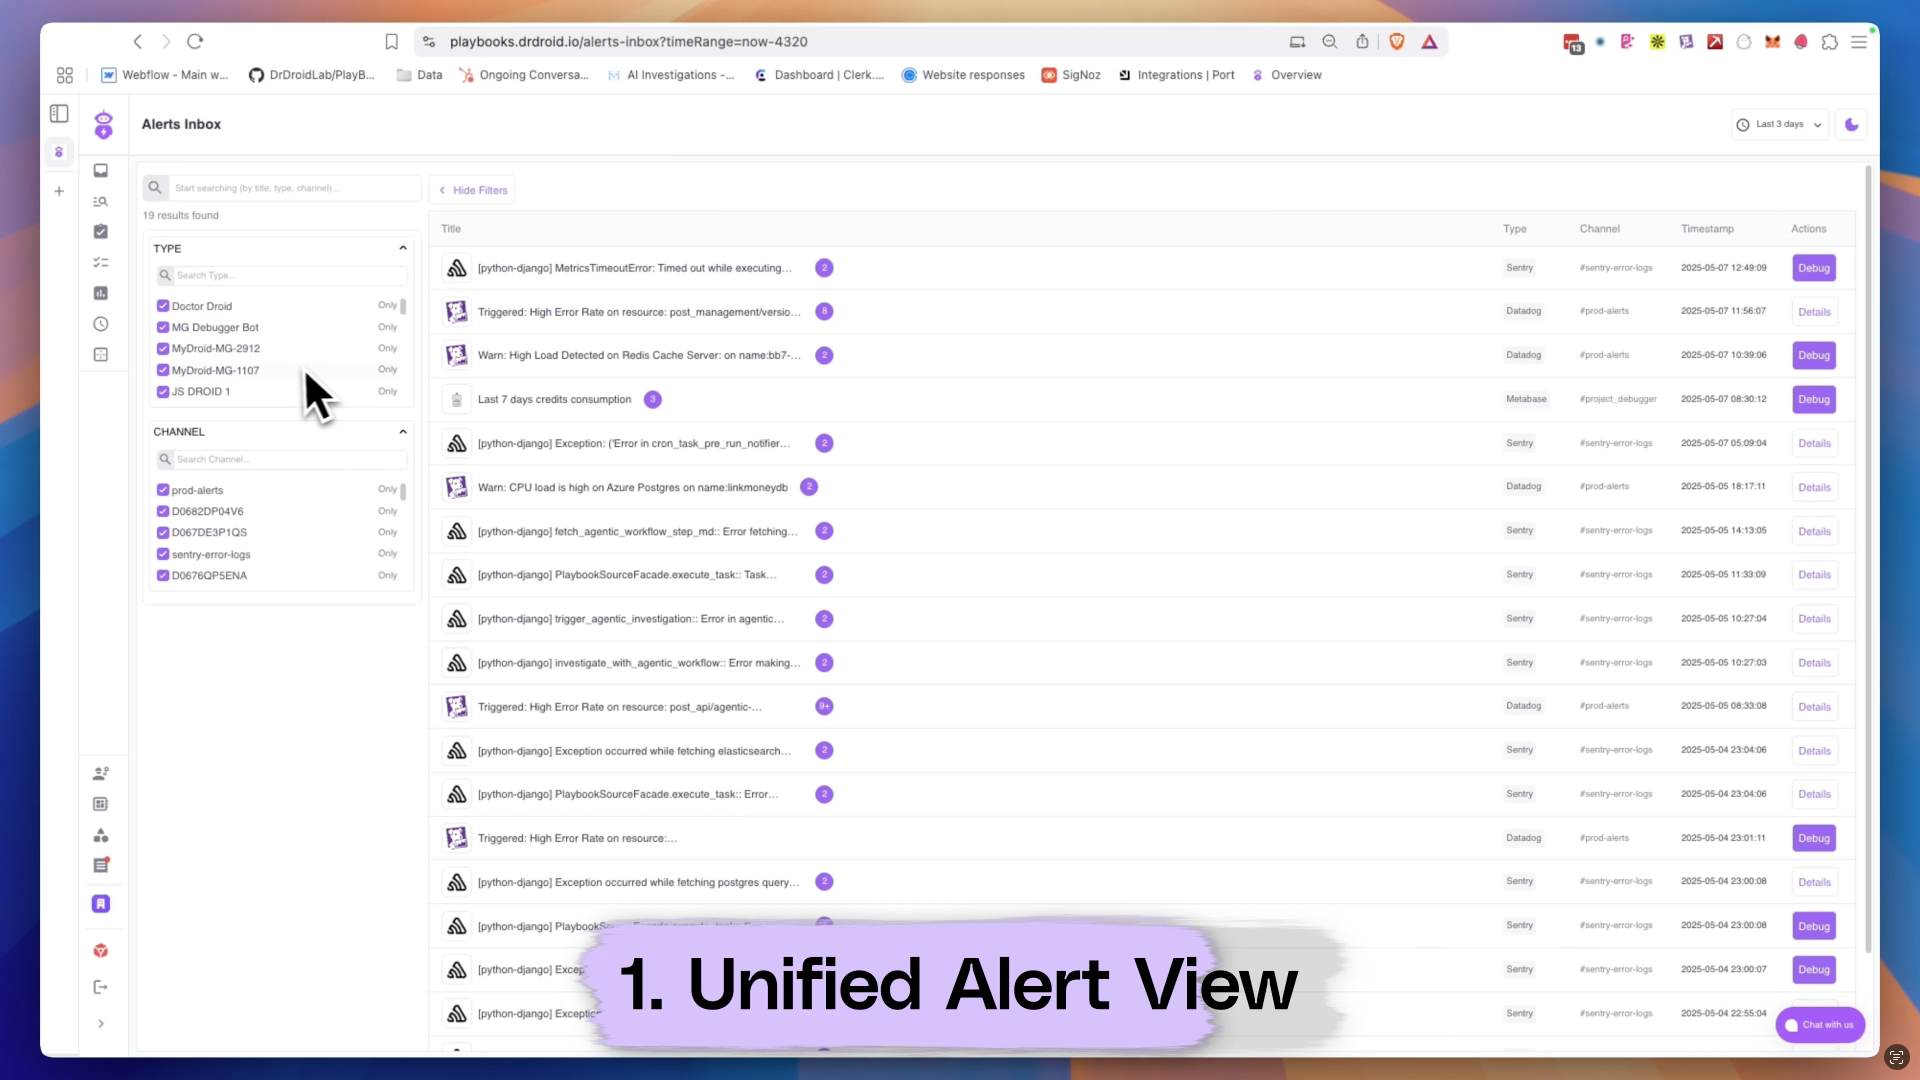
Auto Grouping of repeated alerts
Recurring alerts with the same title are auto-grouped together to reduce noise and make it easier to triage common issues.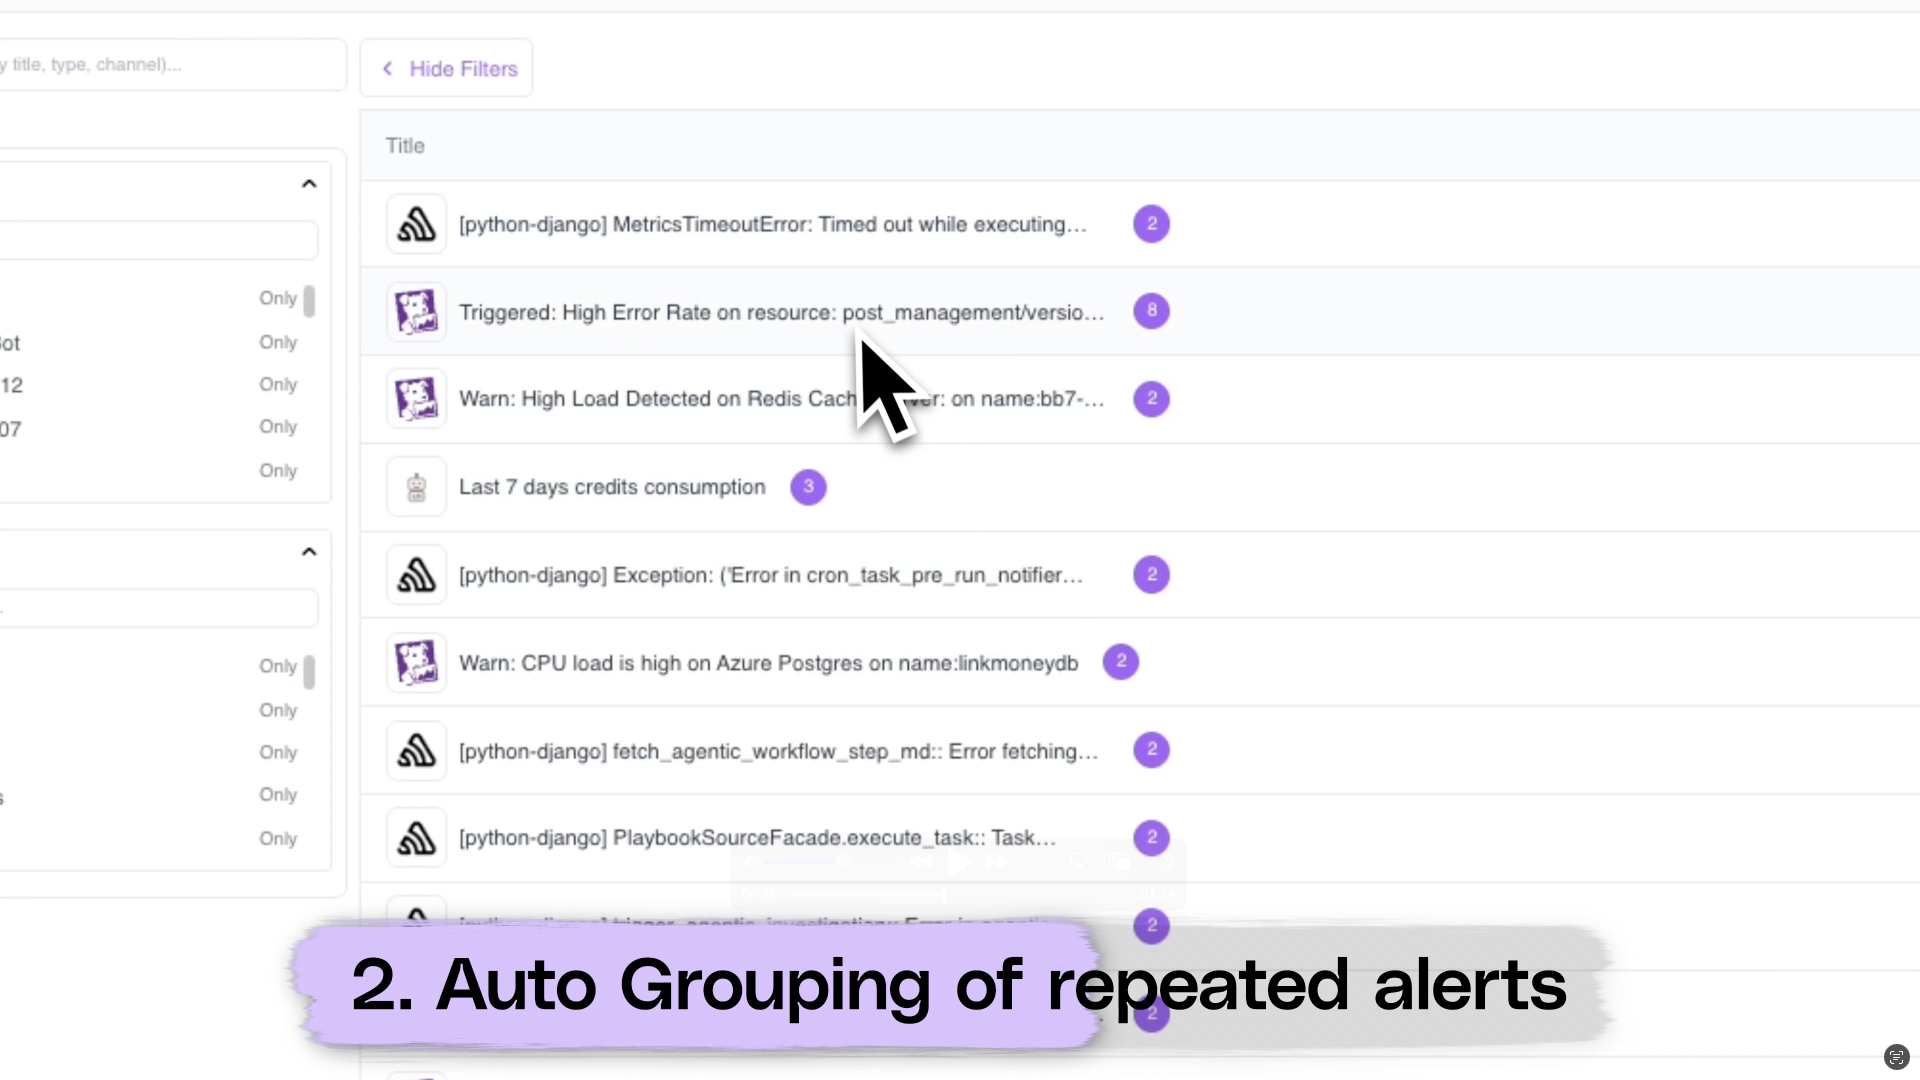
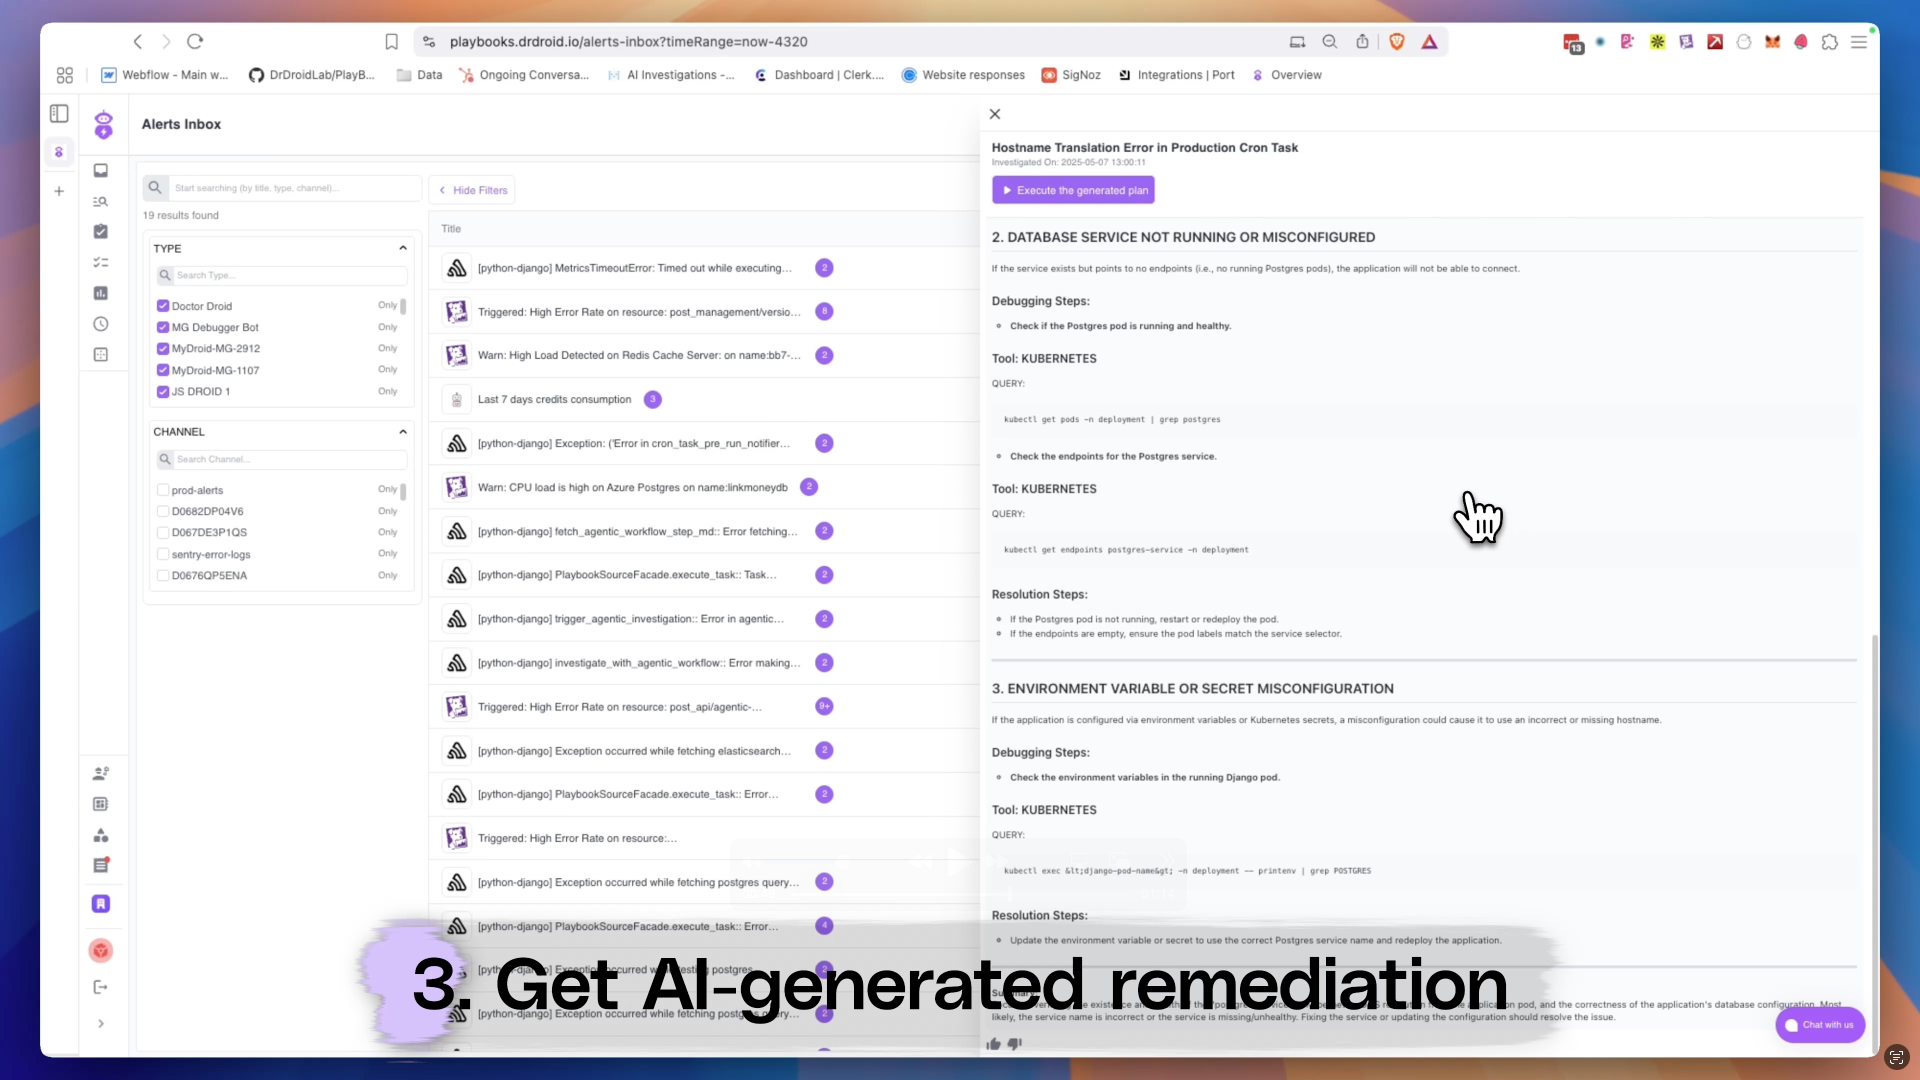
Get AI-generated remediation
Instantly run a debug flow on any alert and get pinpointed remediation suggestions — powered by Doctor Droid’s AI engine.