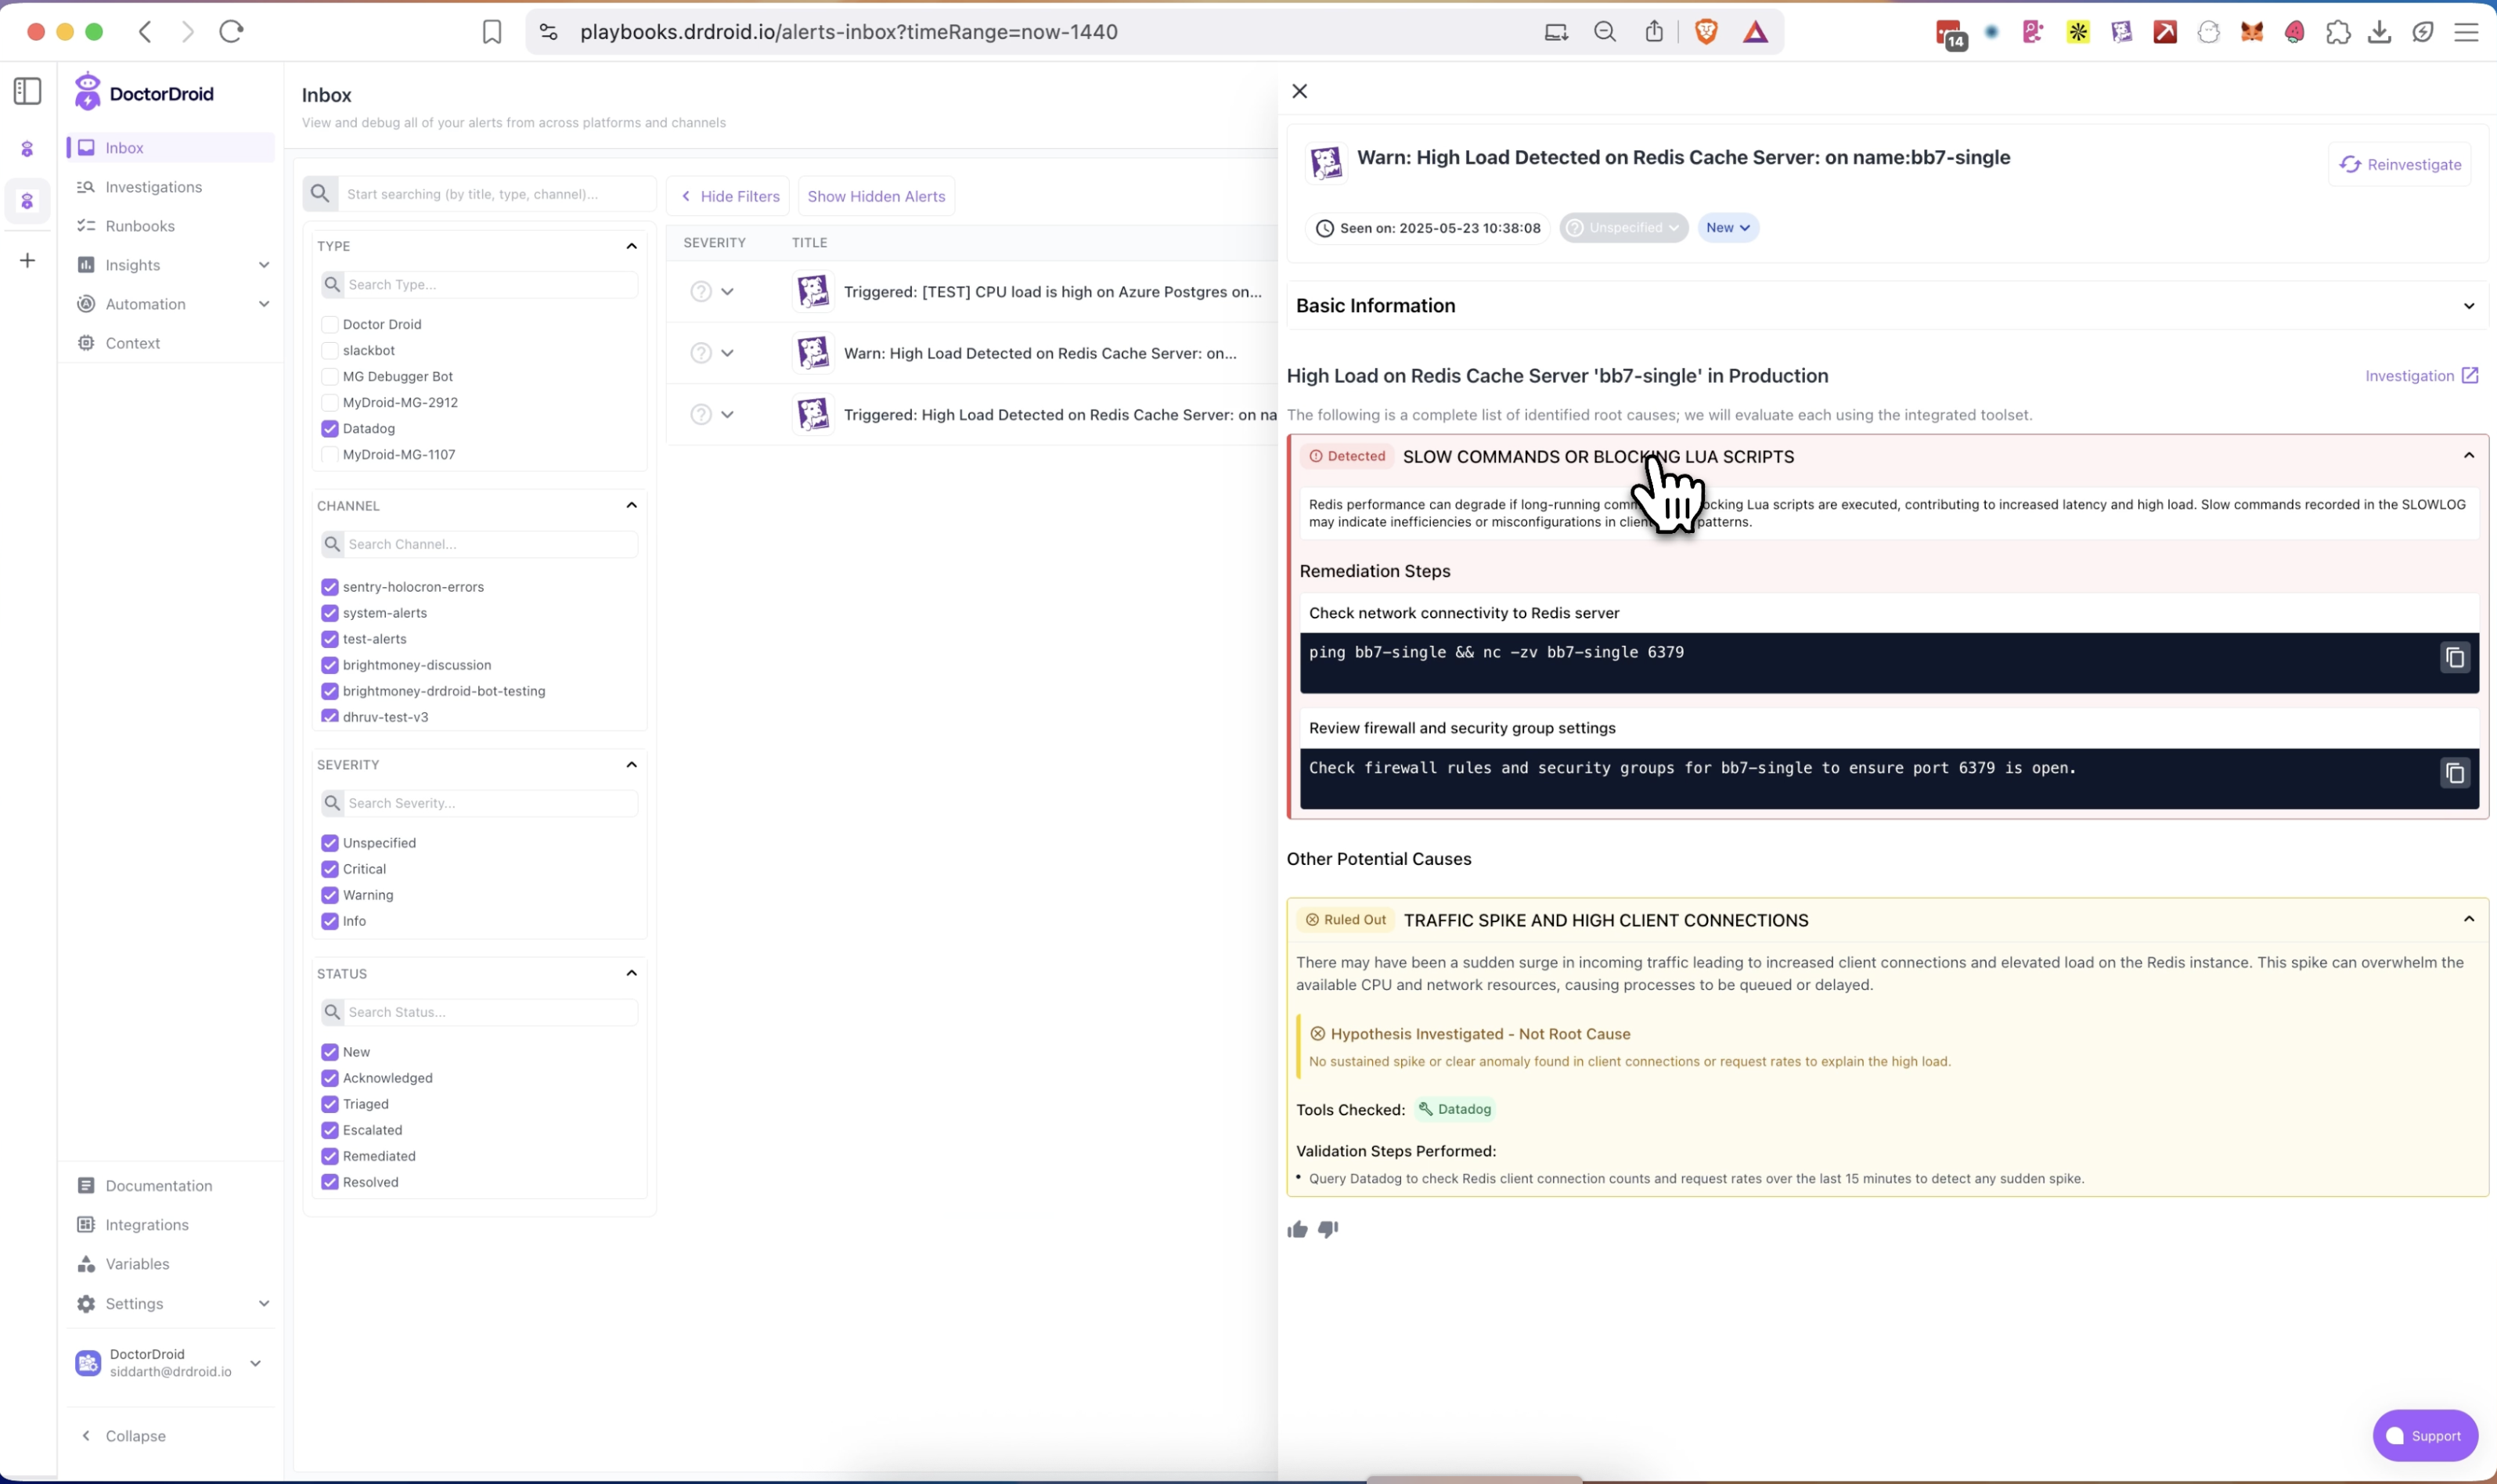
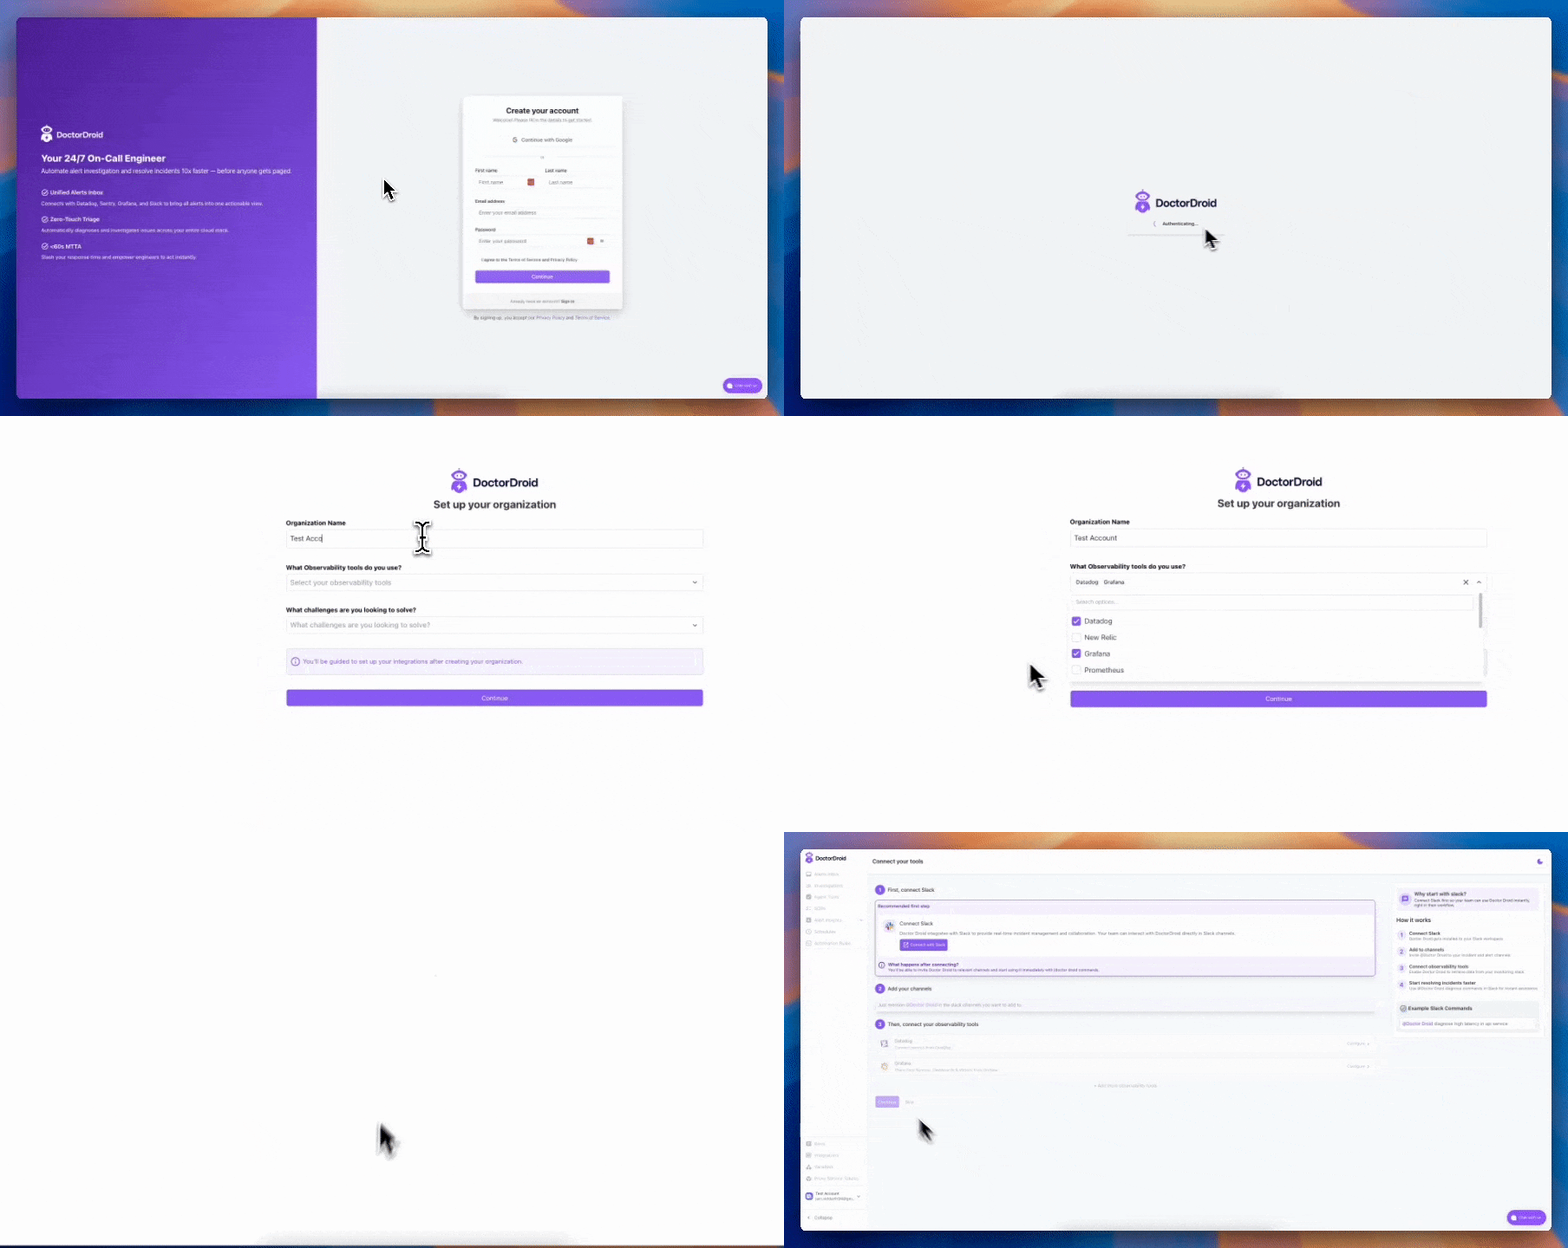
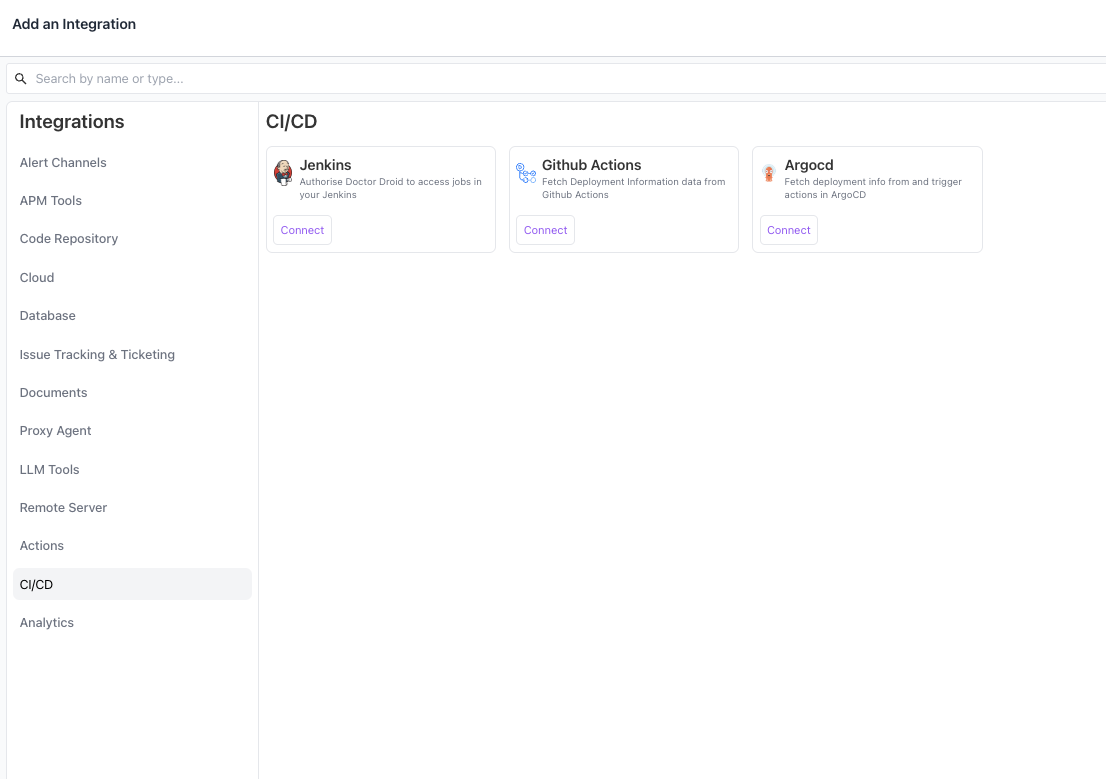
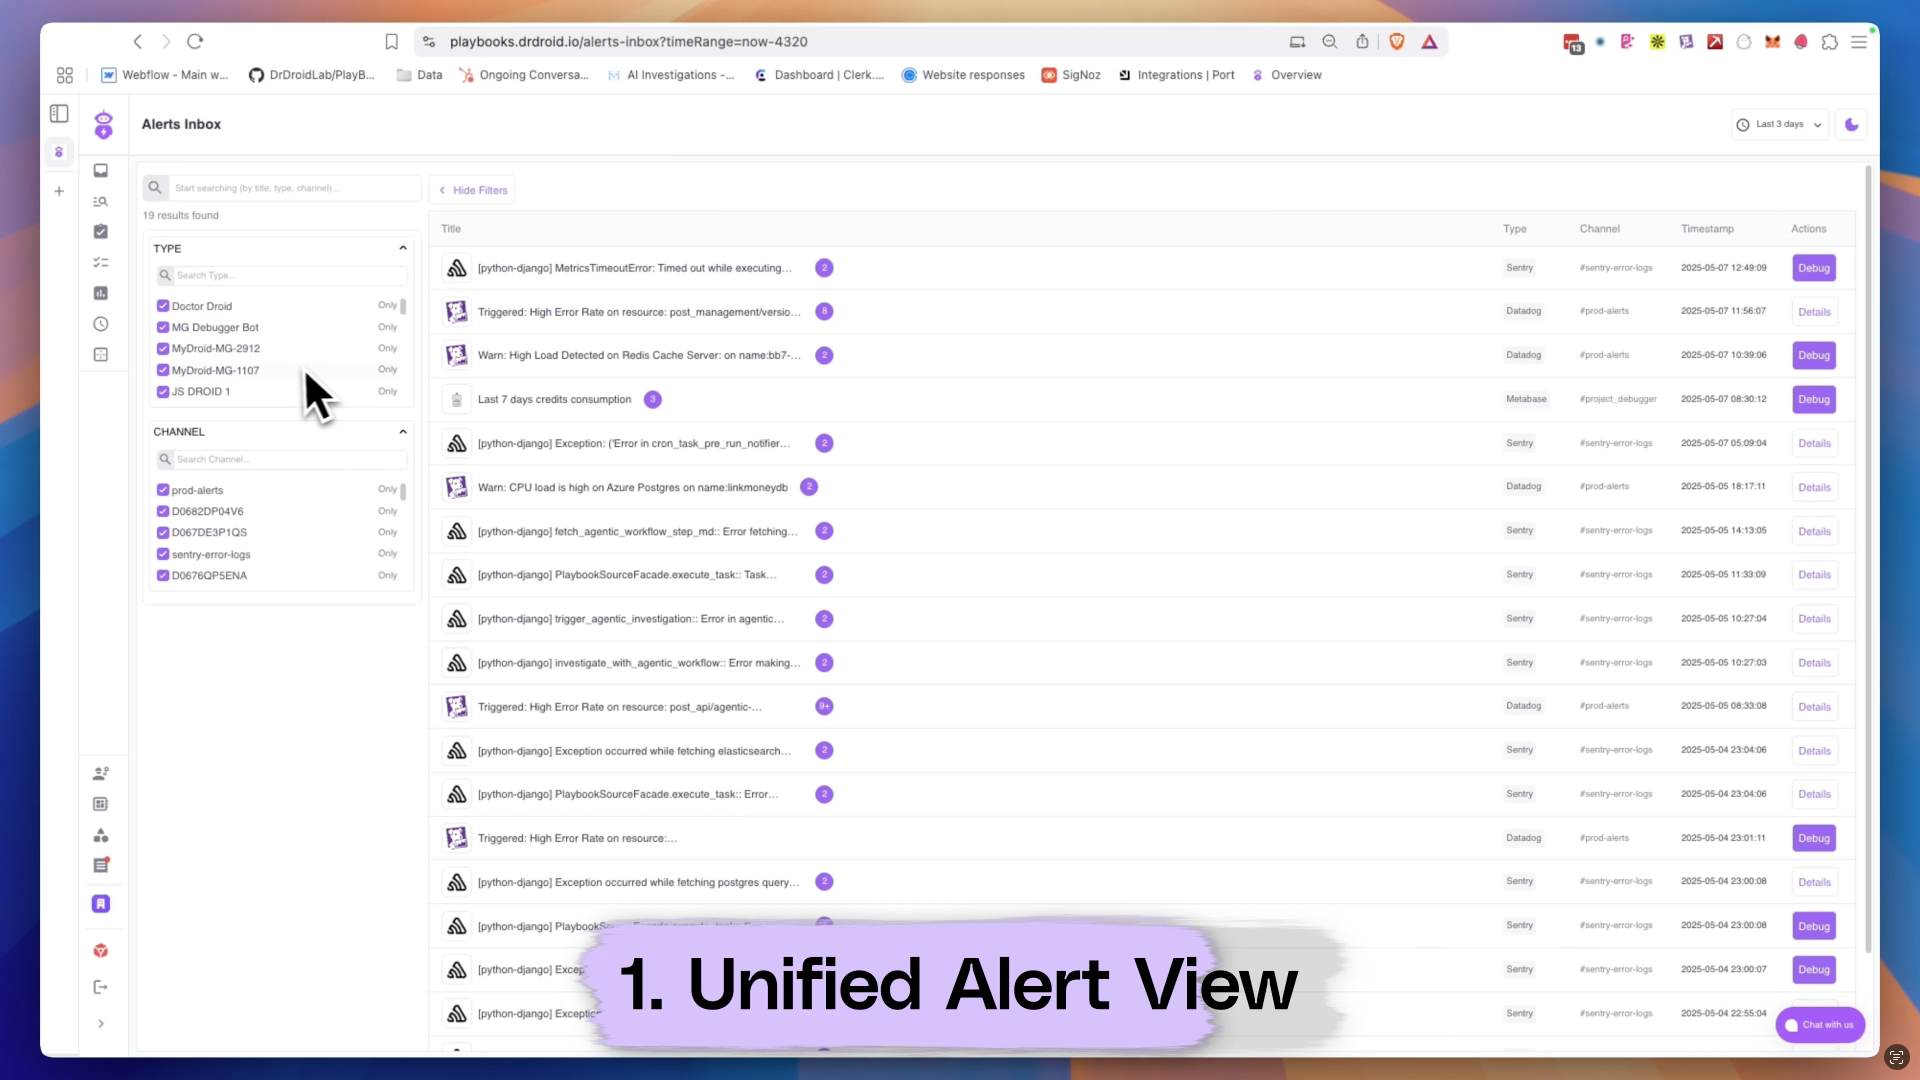
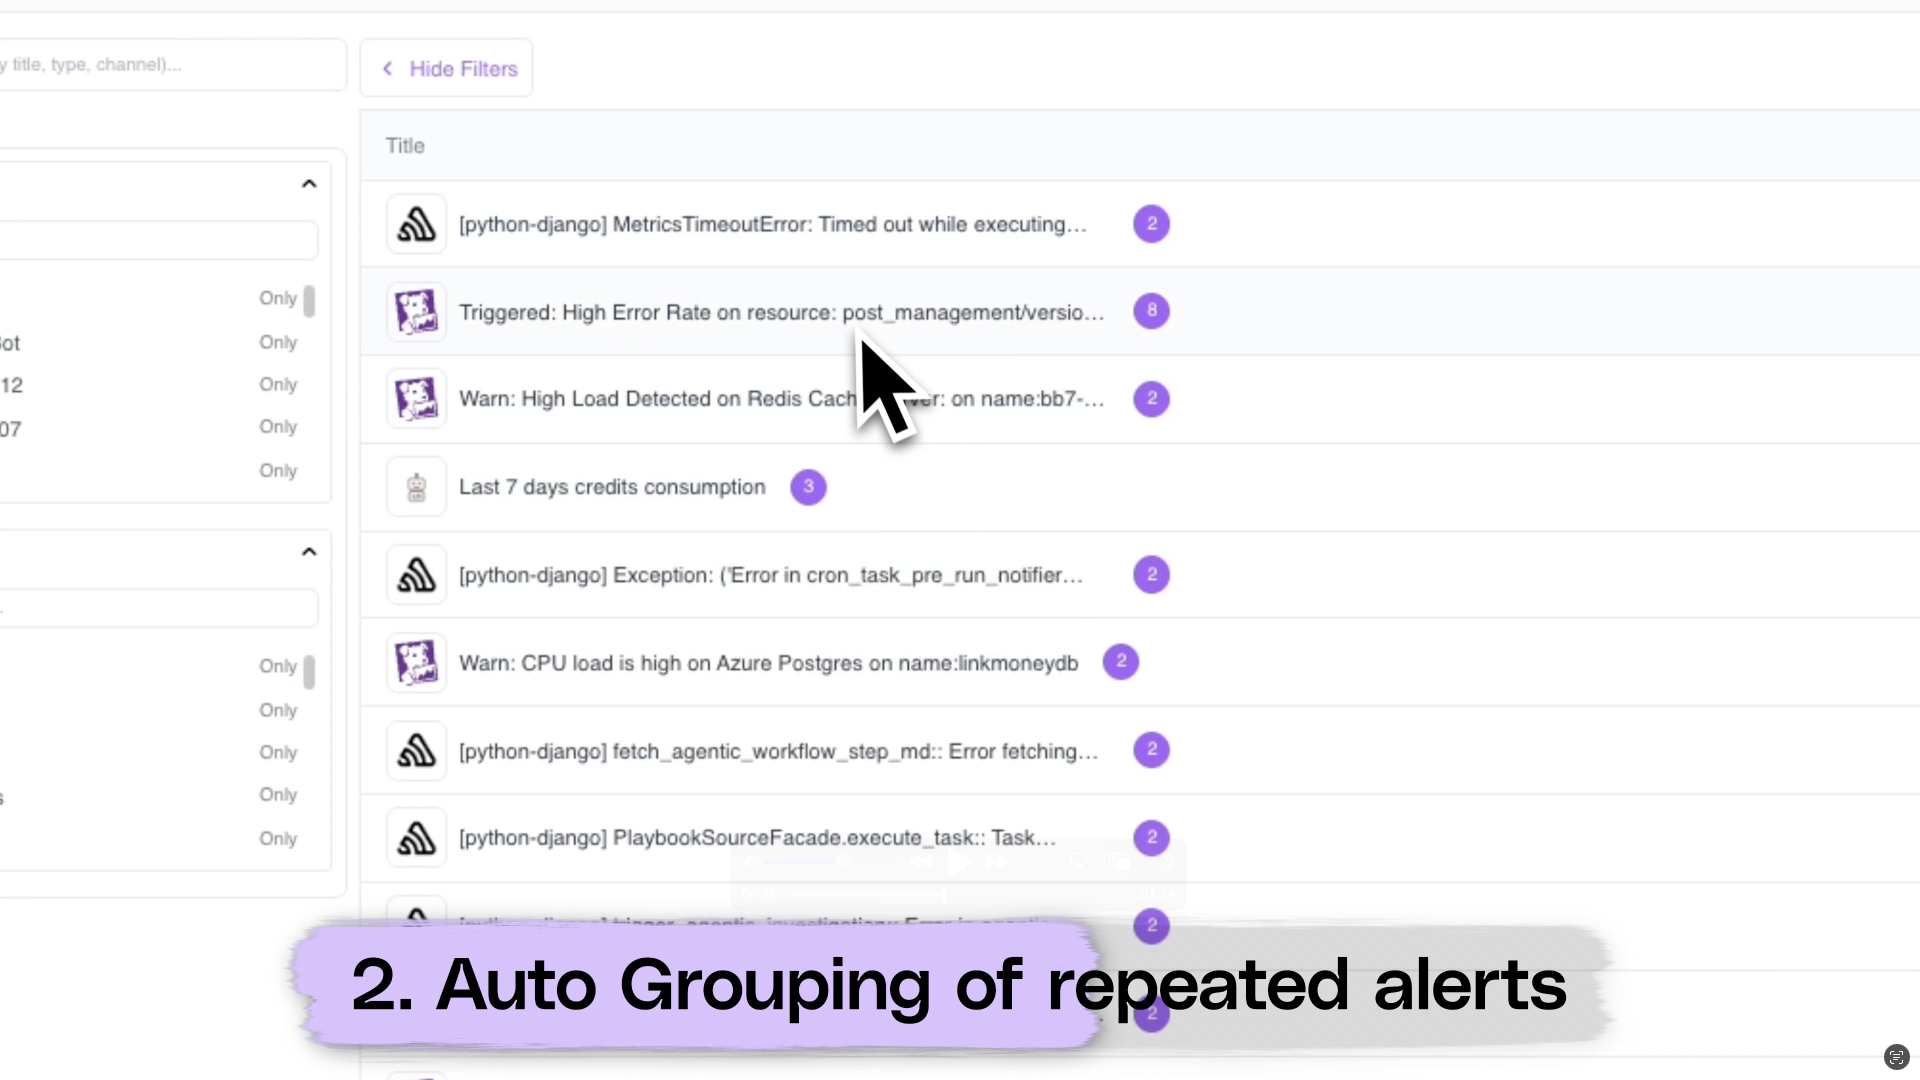
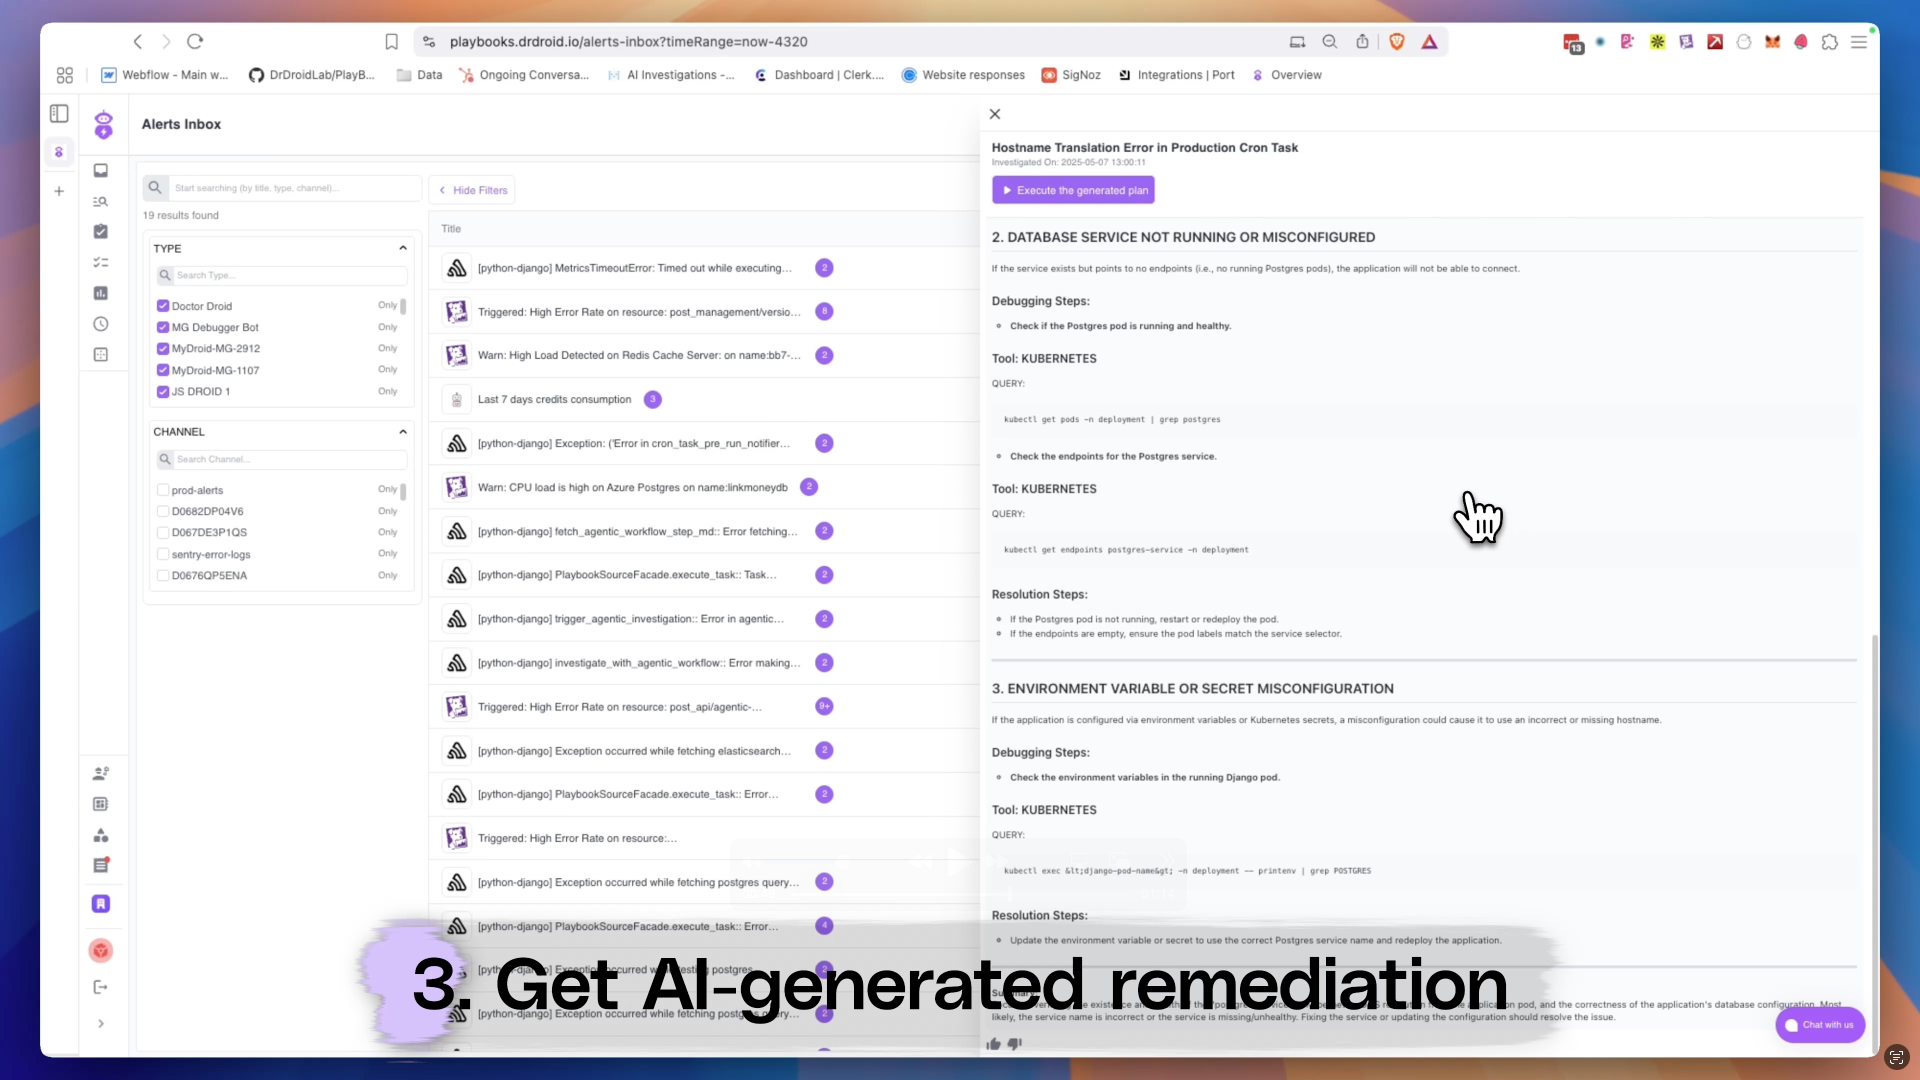
In this changelog, we discuss the 3 new added integrations, a Sandbox (which can be accessed without login) and slack integration to enable auto-trigger of a playbook.

Integrations added:

  • New Relic Integration

  • Datadog Integration

  • PostgreSQL


Feature work:


  • Editing existing playbook (only allowed by creator).


  • Playbook auto-triggering from a Slack alert.


Performance:

  • Reduced time to fetch tool assets from source page.

Metadata:

  • Improved metadata quality for PagerDuty & OpsGenie alerts.
  • Added a tabular data format with week over week analysis of noisy alerts.

WIP:

  • Automated RCA recommendation.

This changelog mentions newly added integrations (Cloudwatch Logs, Clickhouse DB) and sample playbooks as well as improvements to playbook metadata loading time and upgrades.

Integrations added:

  • Cloudwatch Logs
  • Clickhouse DB

Feature work:

  • Playbook metadata loading time
  • Enabling sample playbooks for all users
  • Playbook upgrade -- deletion, adding notes, external links & markdown

In the last two weeks, key updates include the launch of On-Call Playbooks with metadata integrations for New Relic, Datadog, Cloudwatch, and Grafana, as well as executions for Cloudwatch Metrics, Cloudwatch Logs, and Grafana Panels. Additionally, an Alert Insights Slack App has been submitted for Directory Publishing.

here are some of the key updates accomplished:

  1. On-Call Playbooks are now LIVE with following metadata integrations:

    1. New Relic

    2. Datadog

    3. Cloudwatch

    4. Grafana

  2. On-Call Playbooks are now LIVE with following executions:

    1. Cloudwatch Metrics

    2. Cloudwatch Logs

    3. Grafana Panels (Prometheus)

  3. Alert Insights Slack App Submitted for Directory Publishing

The team achieved milestones including going live on Datadog Integrations and launching a private beta of Playbooks for faster issue investigation. They also integrated and supported Coralogix alerts on the Alert Insights dashboard.

In the last two weeks, our team has achieved a few critical milestones:

  1. Went live on Datadog Integrations -- you can read more about the integrations and it's capabilities here -- https://docs.datadoghq.com/integrations/doctordroid/

  2. Launching private beta of Playbooks -- a faster way to investigate issues.

    1. Create a playbook with recommended steps to investigate an issue or add new steps as per your context.

    2. Auto-discovery of metadata for the stack pre-connected -- get full dictionary of all the assets accessible in the playbook.

  3. Integration & support for Coralogix alerts on the Alert Insights dashboard

In the last 2 weeks, new features were launched including Google Chat integration, deeper integrations with monitoring tools, a Datadog integrations plugin, and alert enrichment for Datadog. Personalization was also added to the User Experience.

Here are some of the things launched in the last 2 weeks:

  1. Added Google Chat -- an alternative to Slack channels popularly used by teams in the Google ecosystem.

  2. Enriching alert insights with

    1. Deeper integrations with monitoring tools: Sentry, New Relic, Cloudwatch, Datadog.
    2. Improved annotation model for different tools. Added support for Robusta, Prometheus_AlertManager and Signoz.
    Some of the labels that we are now able to extract from the alerts basis the improved model

    Some of the labels that we are now able to extract from the alerts basis the improved model

  3. Datadog integrations plugin submitted for automated diagnosis

  4. v0 of the alert enrichment for Datadog -- Imagine receiving an alert in your system and automatically receiving an analysis of recent deployments and metrics in the service.

    A sample analysis provided by our bot

    A sample analysis provided by our bot

  5. Adding personalisation into our User Experience, handling some dangling edge cases and strengthening our architecture. (no picture for this one ;) )

In this release, we discuss updates on the alert insights bot, including transitioning to a Native UI, upgrading the backend, adding intelligence for surfacing relevant insights, and new integrations with Google Chat Spaces and Sentry. The decision was made to not move forward with the playbooks feature, instead focusing on intelligent auto-diagnosis algorithms, API-first data fetching, and notification-led delivery.

The last two weeks have been a lot of development on the alert insights bot. Here's what we delivered:

  • Native UI: Transitioned from Streamlit to Native UI for the alert insights dashboards.
  • Upgraded backend: Productised the entire insight generation algorithm.

These both combined has helped reduce the Time-To-Value from 4-12 hours to < 5 minutes.

  • Added intelligence: Auto-surface relevant insights by analysing the shape of the alerts data enriched for a team.
  • New Integrations: Google Chat Spaces (for alerts), Sentry (for data enrichment)

This is helping the user get actionable insights without having to search for it.

We've decided to not go ahead with playbooks feature in our current form.

Why? Most production troubleshooting are exploratory data analytics and asking users to codify EDAs is non-trivial and can become a significant bottleneck to adoption. Instead, we are doing the following:

  • Added intelligence: Frontloading the bot with intelligent auto-diagnosis algorithms that operate with ZERO upfront effort.
  • API-first data fetching: Until explicitly requested by power users, we are deciding to stick to observability tools with stable data APIs. We have made progress on Datadog APIs, New Relic NerdGraph and AWS Boto3 cloudwatch metrics. Early adopters will be able to able to get instant L1 diagnosis in their slack channels and / or observability tools.
  • Notification-led delivery: We are sticking to auto-response to slack alerts as the most prioritised channel for delivering these diagnosis. Sending diagnosis to Datadog via their Events API is also LIVE now.

Playbook generation v0.1

by Siddarth Jain

This changelog summarizes a concept prototyping tool that helps engineering teams automate investigations by writing playbooks in YAML format, connecting with Datadog, Cloudwatch, and New Relic APIs, and providing analysis on dashboards and Slack messages.

In a concept prototyping, we have created a tool that helps write playbooks to automate investigations for engineering teams. Here is the current functionality of the tool:

  • Write YAML type structure to define a playbook. Sample instructions here.
  • Connected with Datadog, Cloudwatch and New Relic APIs. If you're a user to any of these, add your credentials and your intelligence is activated.
  • Get analysis on dashboards in UI as well as in slack messages.

Alerts Insights updation

by Siddarth Jain

In this release, we added new features to Alert Insights including auto-identifying tags from alerts, mapping alerts to their sources, and real-time report updates.

Added capabilities to

  • Auto-identify tags from a given alert
  • Map an alert to the source / tool that generated the alert
  • Auto-integration and real-time report updation

Alerts-Insights v0.1

by Siddarth Jain

Summary: Before December 13th, integrations with various tools were implemented, charts were published as images, and 1-click data fetching was enabled. On December 13th, a streamlit app with aggregate insights at a channel level was published. On December 14th, the structure was changed, an option to remove specific alerts was added, the dashboard was consolidated into a single file, and integration with Google Chats was added.

Pre-13th December:

  • Integrations: Slack[SJ], NewRelic[MG], Datadog[MG], Sentry[MG/AA], Honeybadger[MG/AA], Squadcast[SJ/AA].
  • Published charts as images to users.[SJ]
  • 1-click data fetching from all integrations [MG]

[13th December, 2023]

  • Published streamlit app with aggregate insights at a channel level, with different data sources for every channel.

[14th December, 2023]

  • Changed structure to alert_type (infra, apm, error, container)
  • Added an option for user to remove a specific alert (this can be useful if there was one specific noisy alert that might be making the entire data too noisy)
  • Running entire dashboard from a single file.
  • Added integration to Google Chats.

Here are some key updates since our last update:

  • We made our platform open source -- accessible here!
  • We have launched an upgrade to dashboards such that multiple panels can be added within the same dashboard.
  • We have created a sandbox so users can access and experience the power of Doctor Droid platform without need for creating an account.