added
Metrics Explorer - A quick way to plot trends of events & monitors
almost 2 years ago by Siddarth Jain
In this release, we have launched a Metrics Explorer -- a way to visualize the events sent to Dr. Droid platform.
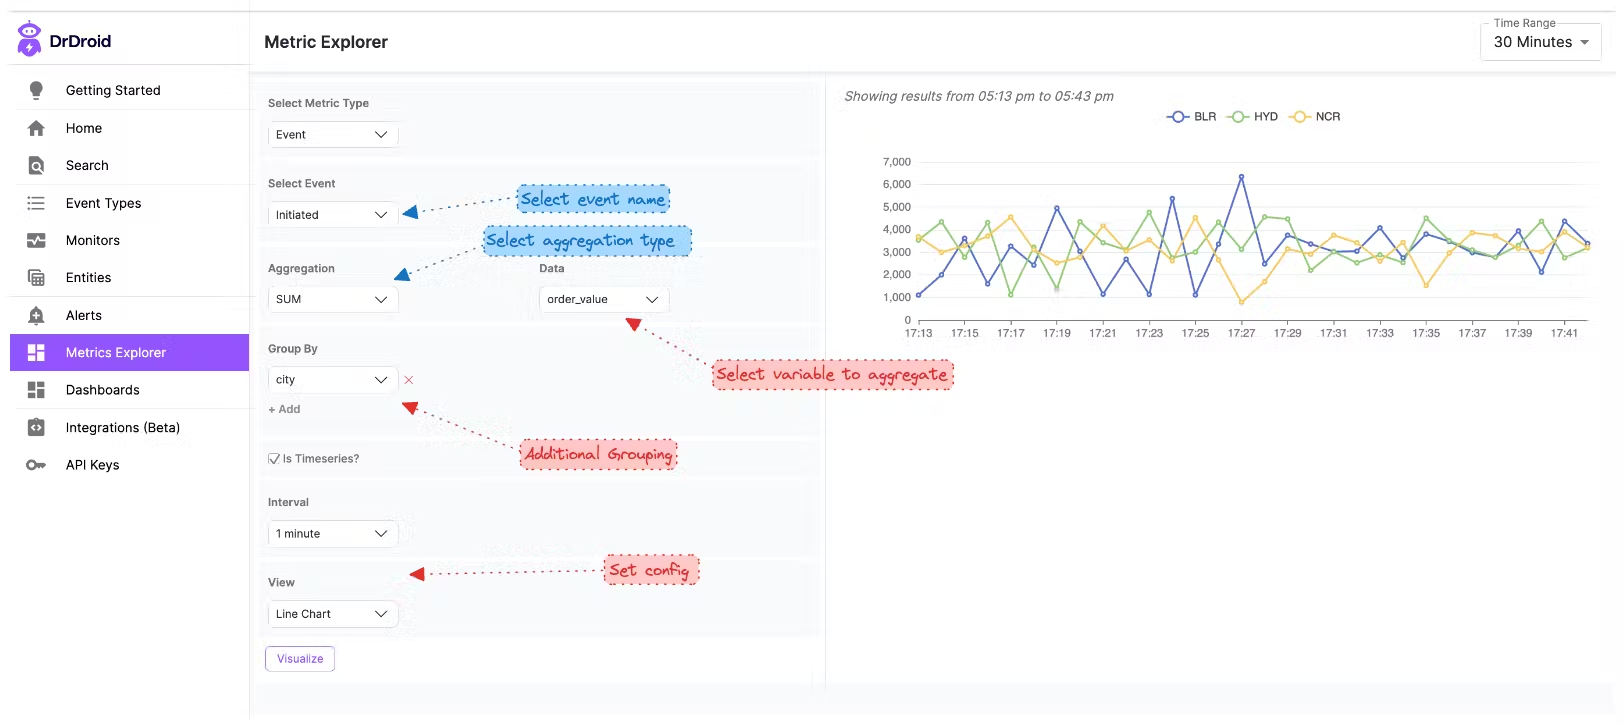
Additionally, for every metric, you can:
- Group by any of the variables, or multiple variables
In case of grouping by multiple variables, it will turn into a non-timeseries table for the time duration selected. - Aggregate by multiple types, including but not limited to SUM, Count, AVG.