- How to build Datadog Connection?
- Types of Querying Permitted on Datadog
Connection:
Step 1: Create an API key associated with your user.
You can name this one ‘dr-droid-key’ and copy the “Key”.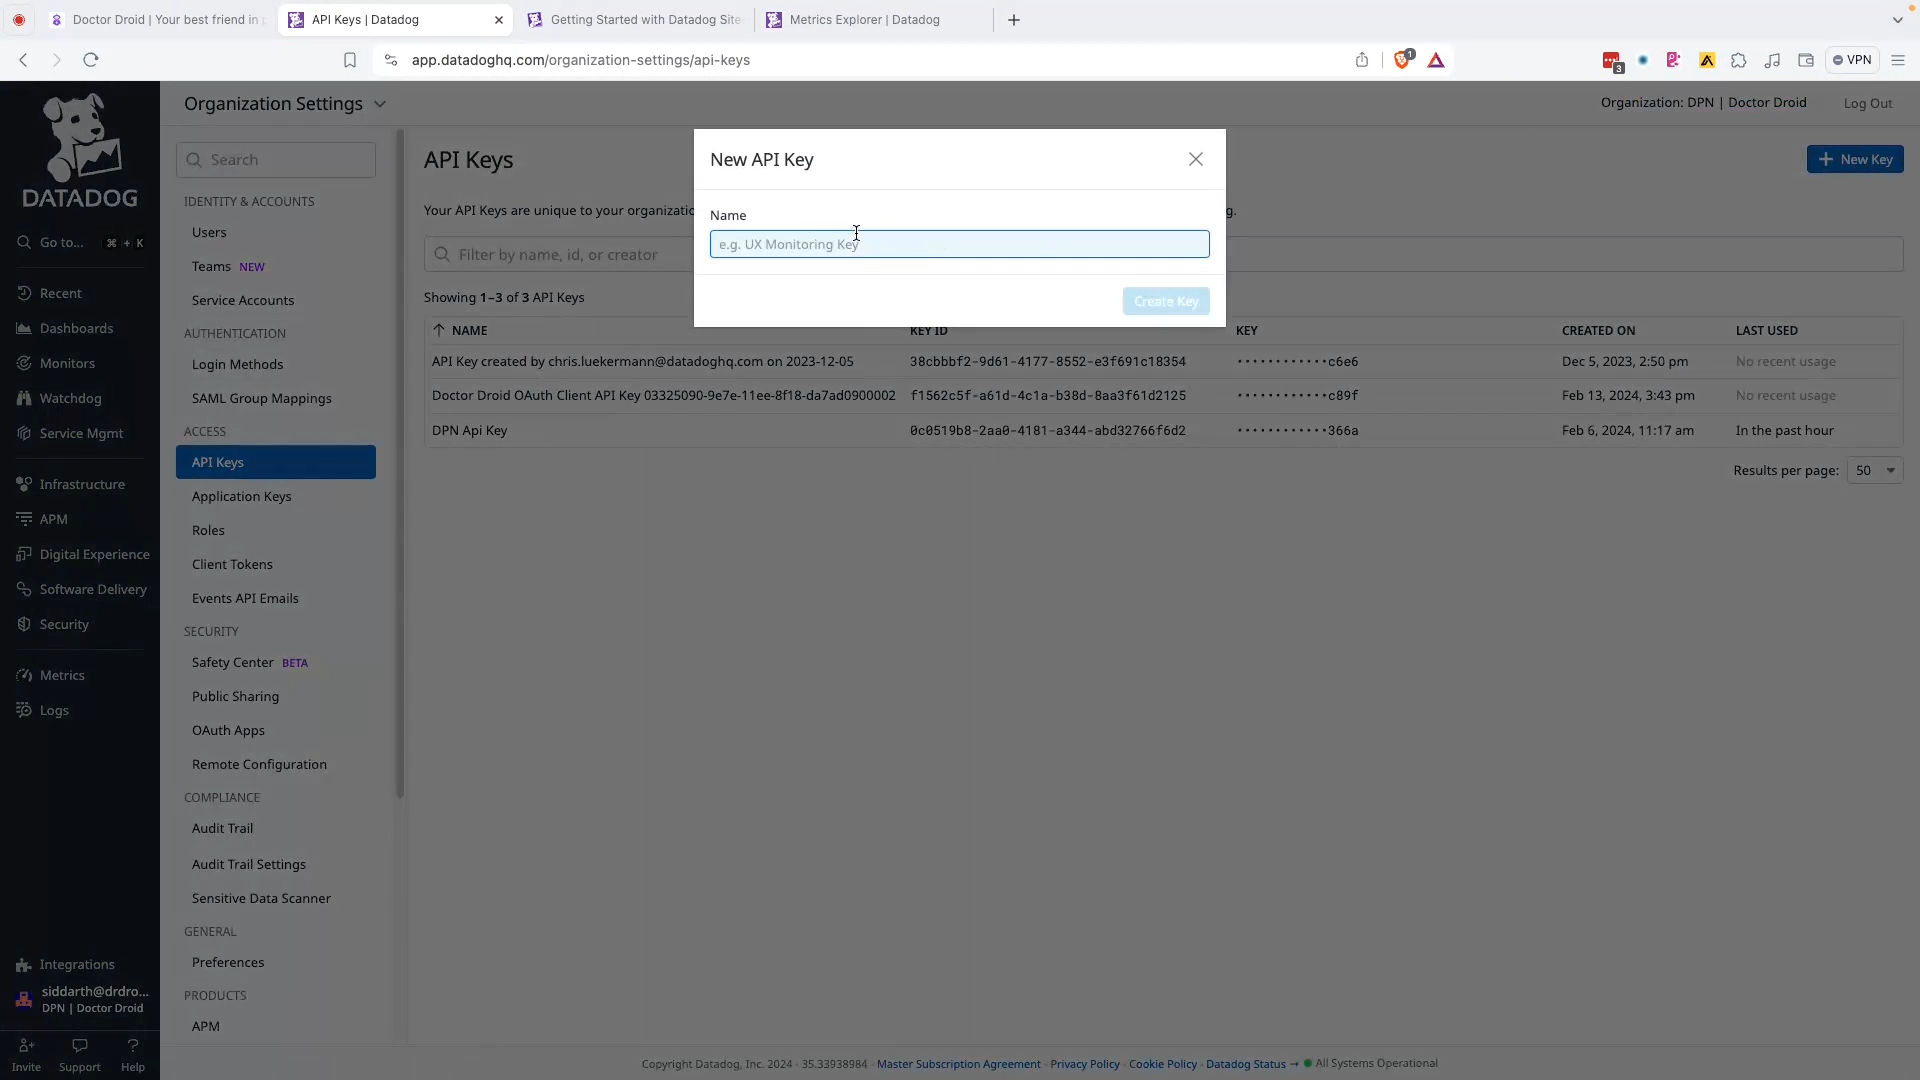
Step 2: Create an APP key with the following scopes:
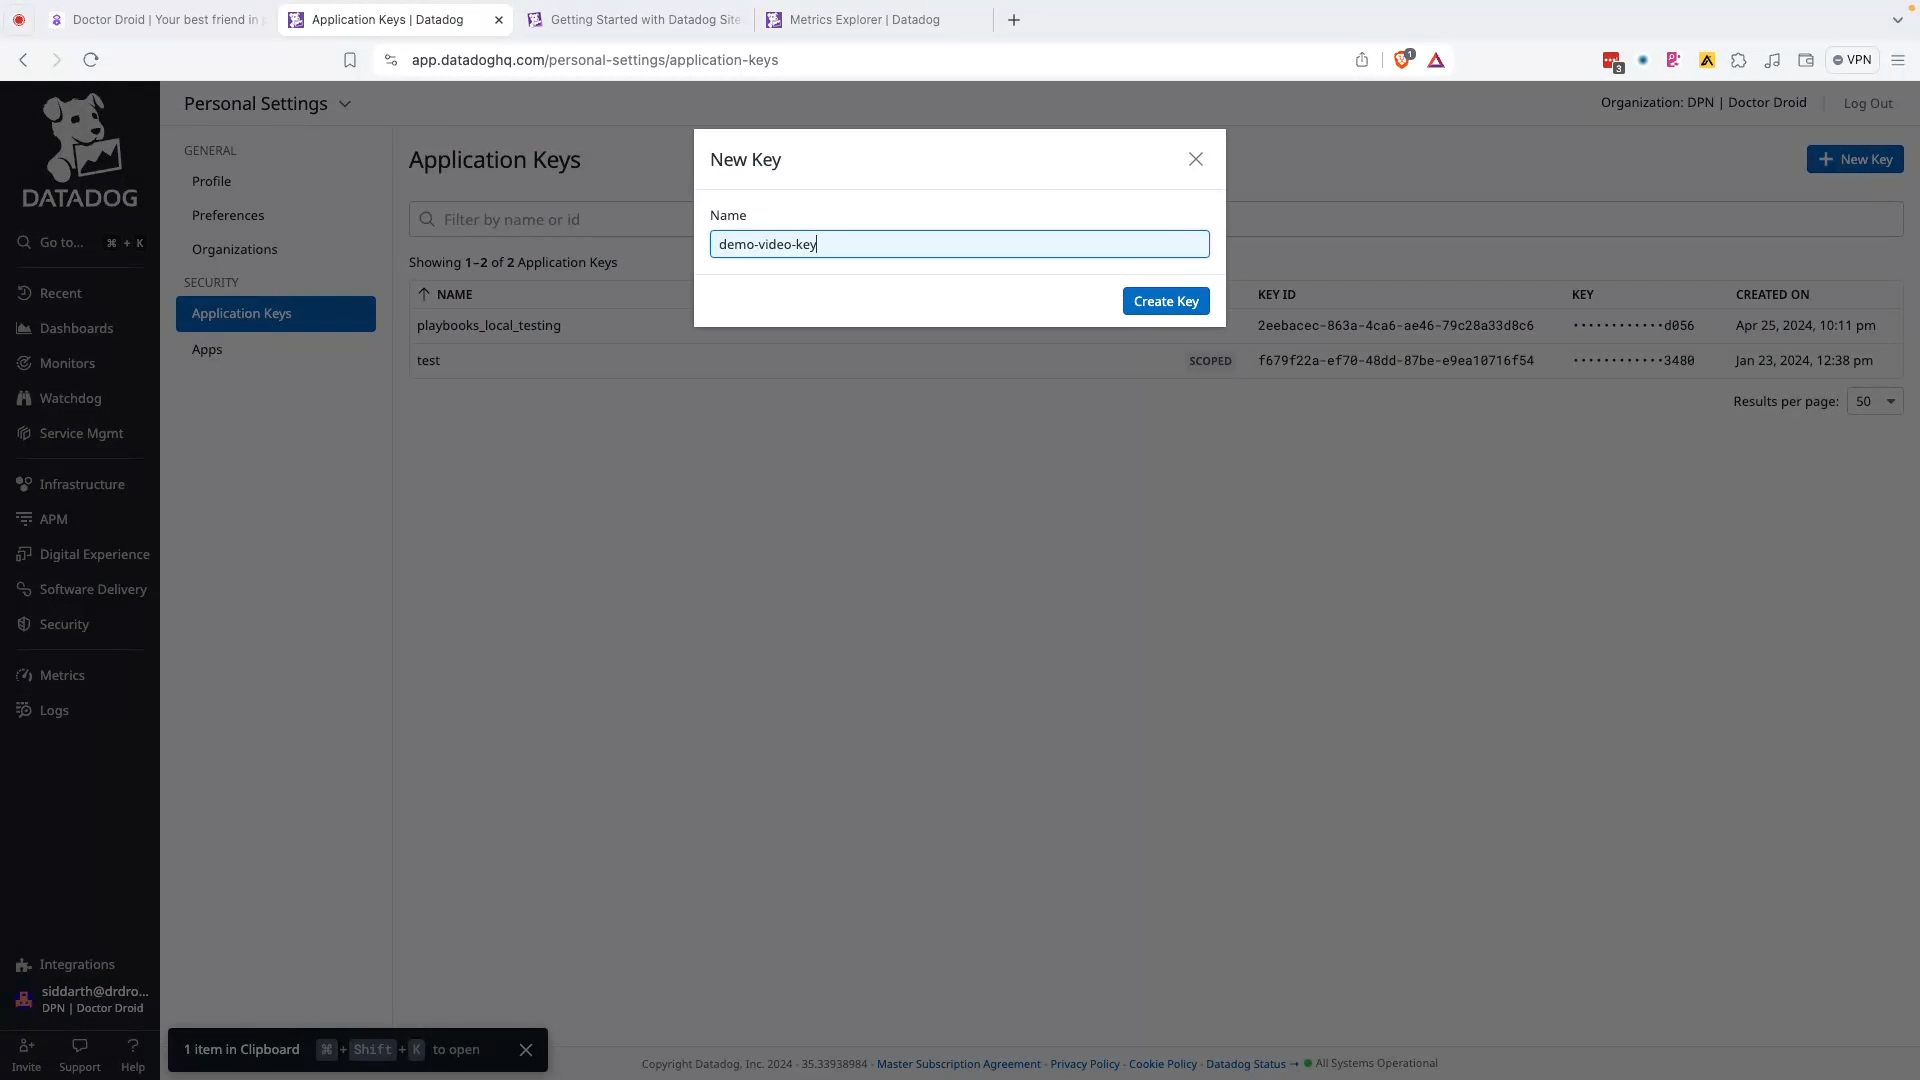
- apm_service_catalog_read
- apm_api_catalog_read
- logs_read_data
- logs_read_index_data
- ci_visibility_read
- dashboards_read
- events_read
- incident_notification_settings_write
- incident_read
- incident_settings_write
- incident_write
- metrics_read
- monitors_read
- slos_read
- create_webhooks
- timeseries_query
- apm_read
Step 3: Enter the relevant Site Parameter:
Read more on the different site parameters here.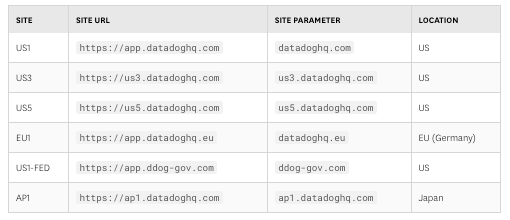
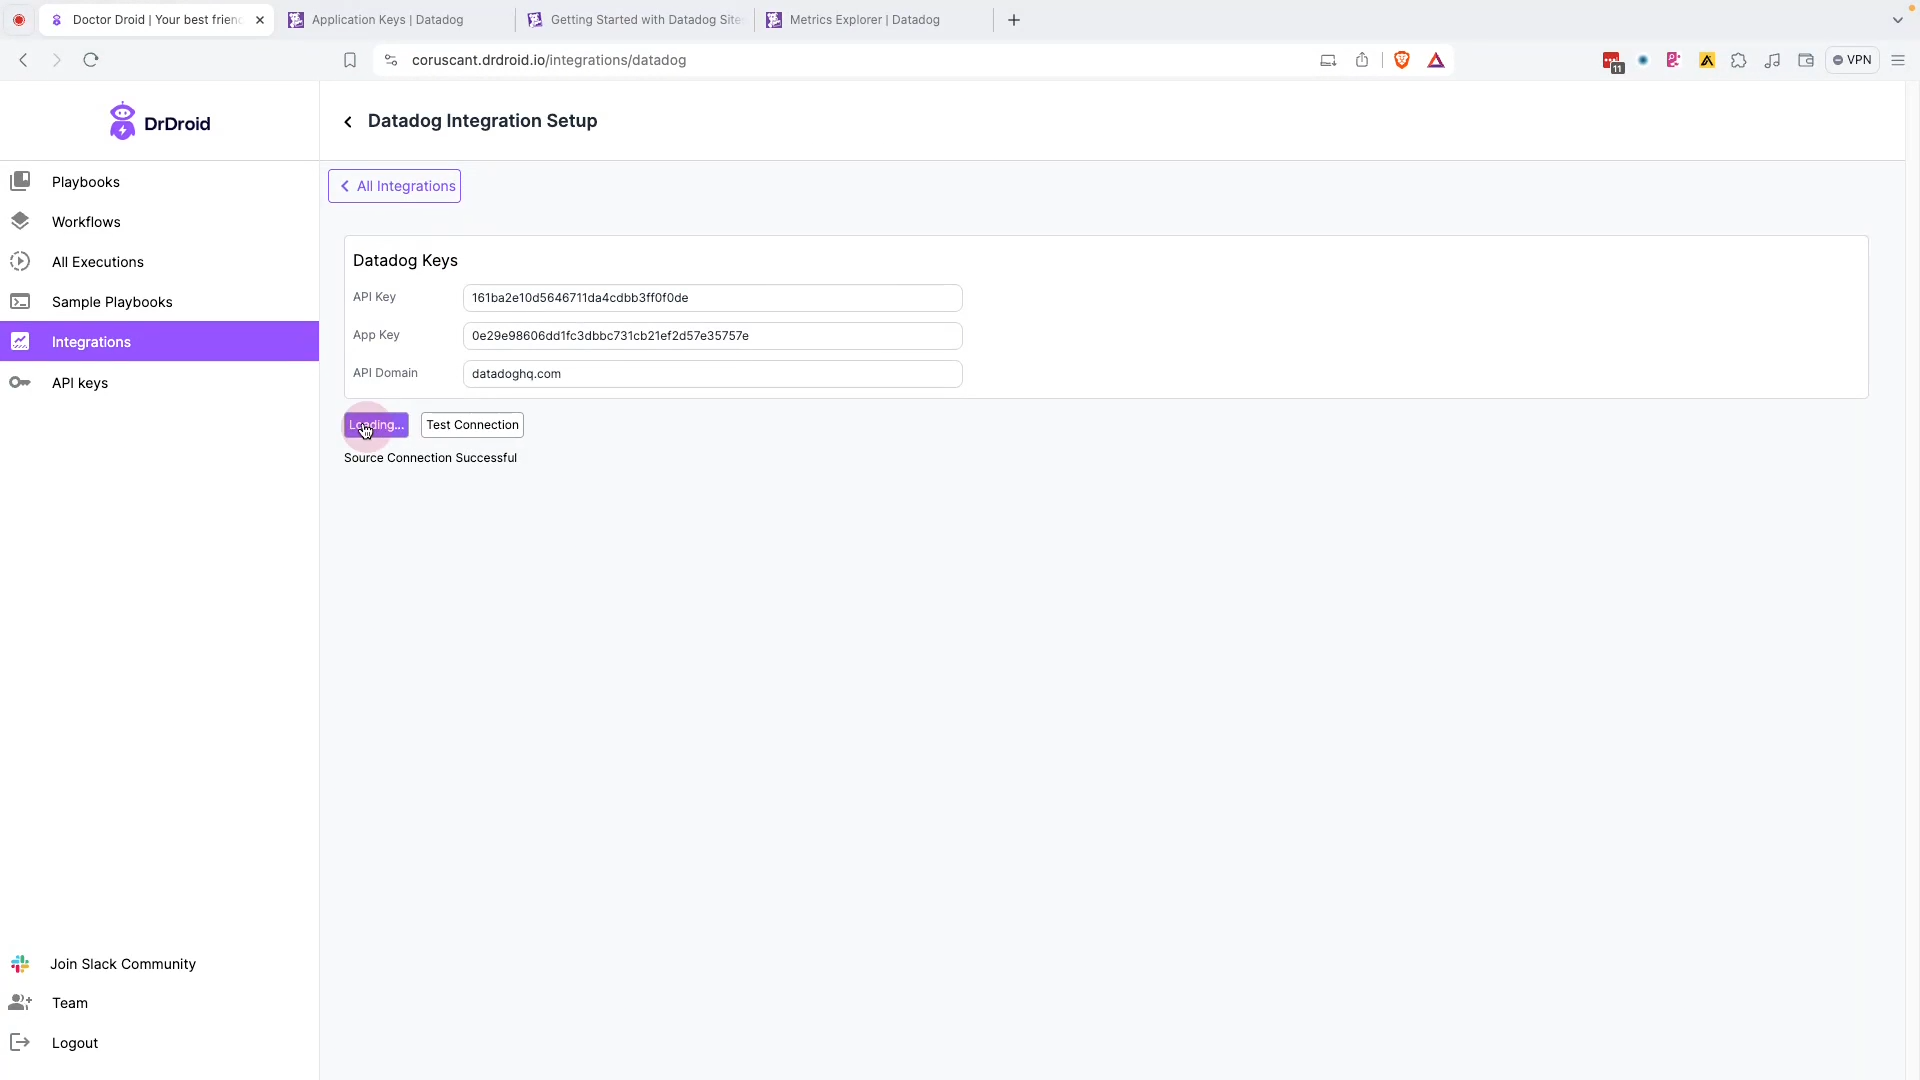
Step 4: Test connection & save
Querying:
Playbooks currently support the following types of queries within Datadog:- Fetching results of any custom datadog metric query.
- Fetching Golden signals by selecting a service name.
- Fetching panels from any custom dashboard in Datadog.
- Selecting any of the metric that has been identified by Datadog’s metric summary.
- Fetching logs from Datadog.