Stateful metrics
Type 2 — Stateful metrics:
In continuation of the previous event (order initiated), let’s assume the next step in the journey of an order is the part when the order is allocated to a driver who would deliver the order.
{
  "name": "Allocation_successful",
  "timestamp": 1677751561100,
  "payload": {
    "order_id": "ekpsHJ9GhQd7OU",
    "delivery_eta": 14,
    "driver_id": 32432
  }
}
The time it takes from order initiation → allocation is a stateful metric that we want to track.
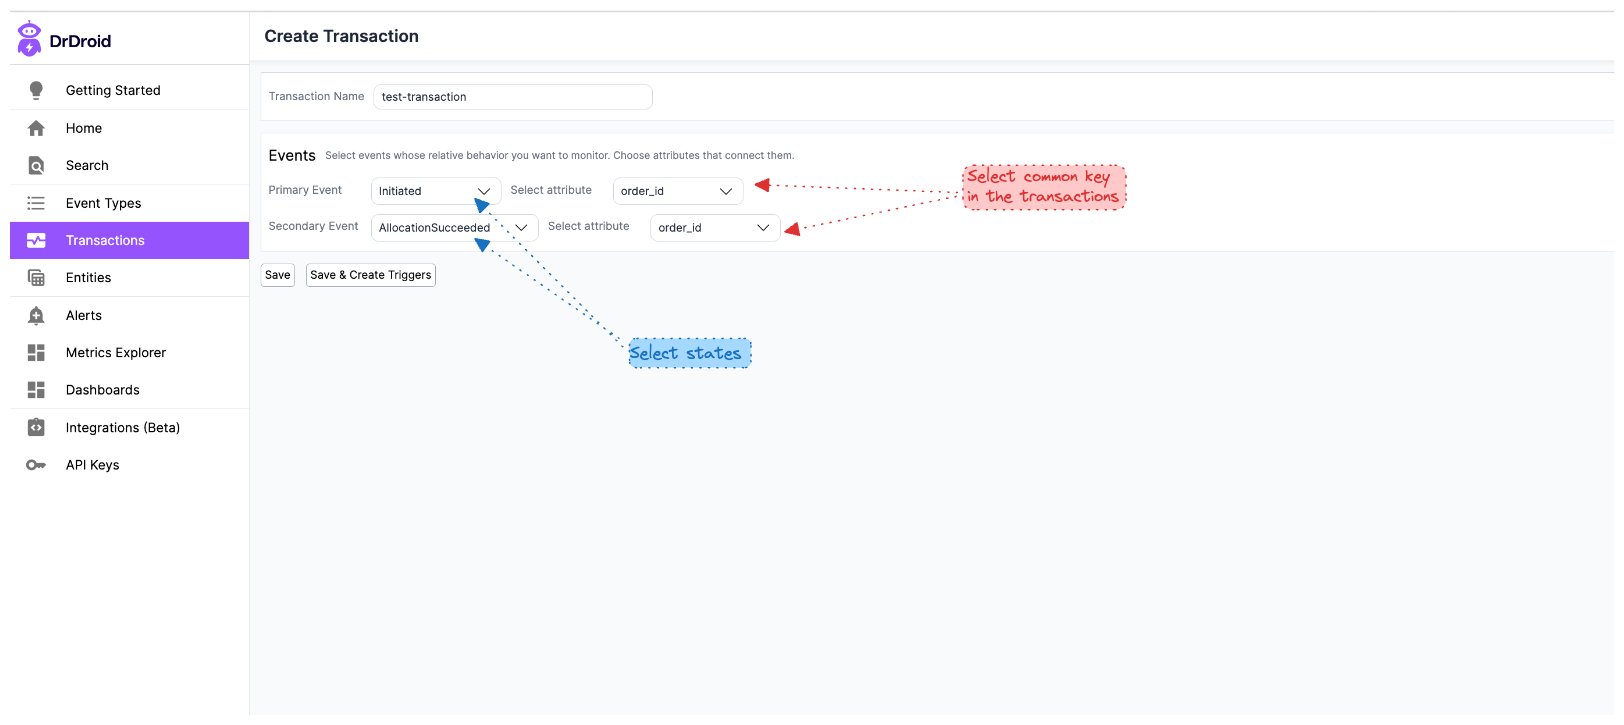
Firstly, define a monitor transaction in the platform.
Now to plot a metric associated with the monitor transaction, just go to Metrics Explorer and select “Metric Type” as “monitor transaction”.
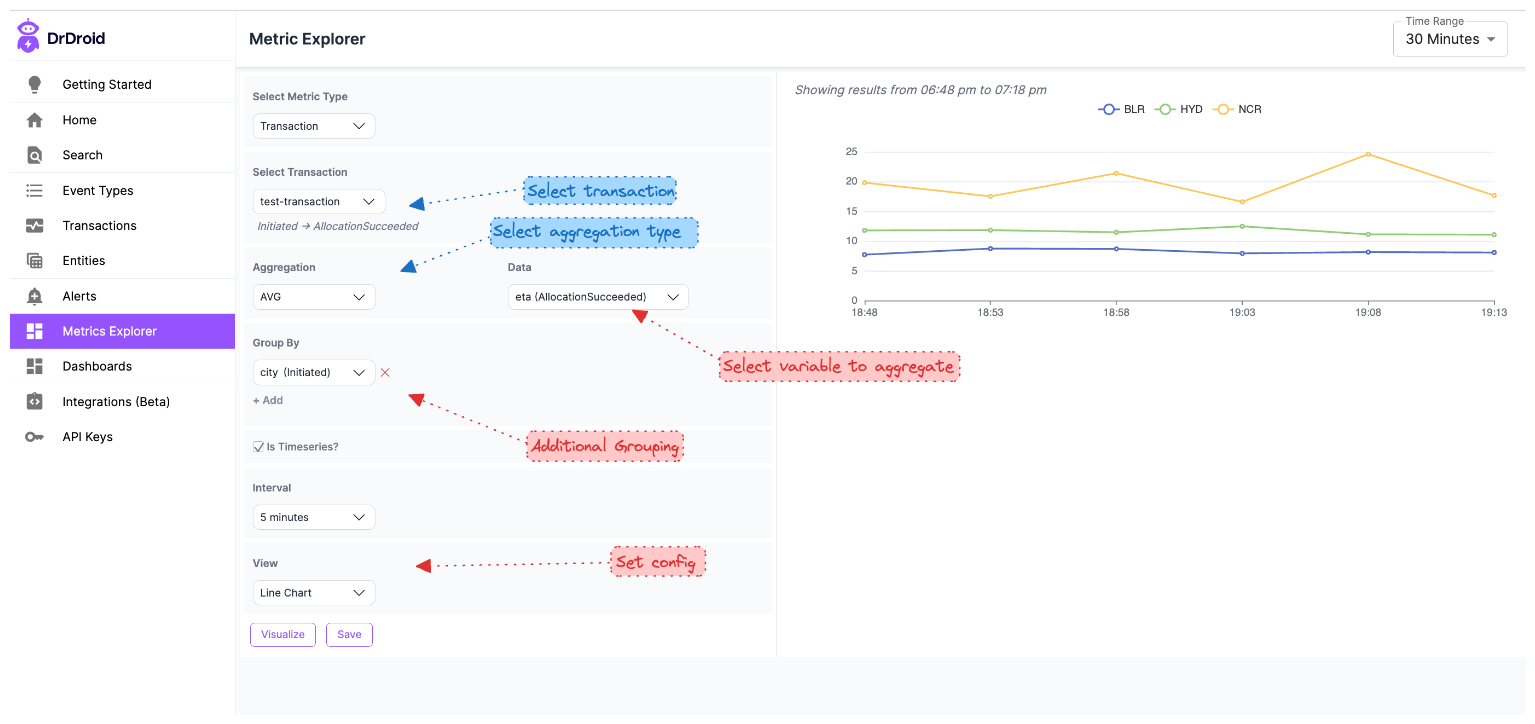
Note that we have plotted the variable from the second state but grouped it by the variable in the first state! You can also plot metrics that are not related to either of the states but about the correlation between them.
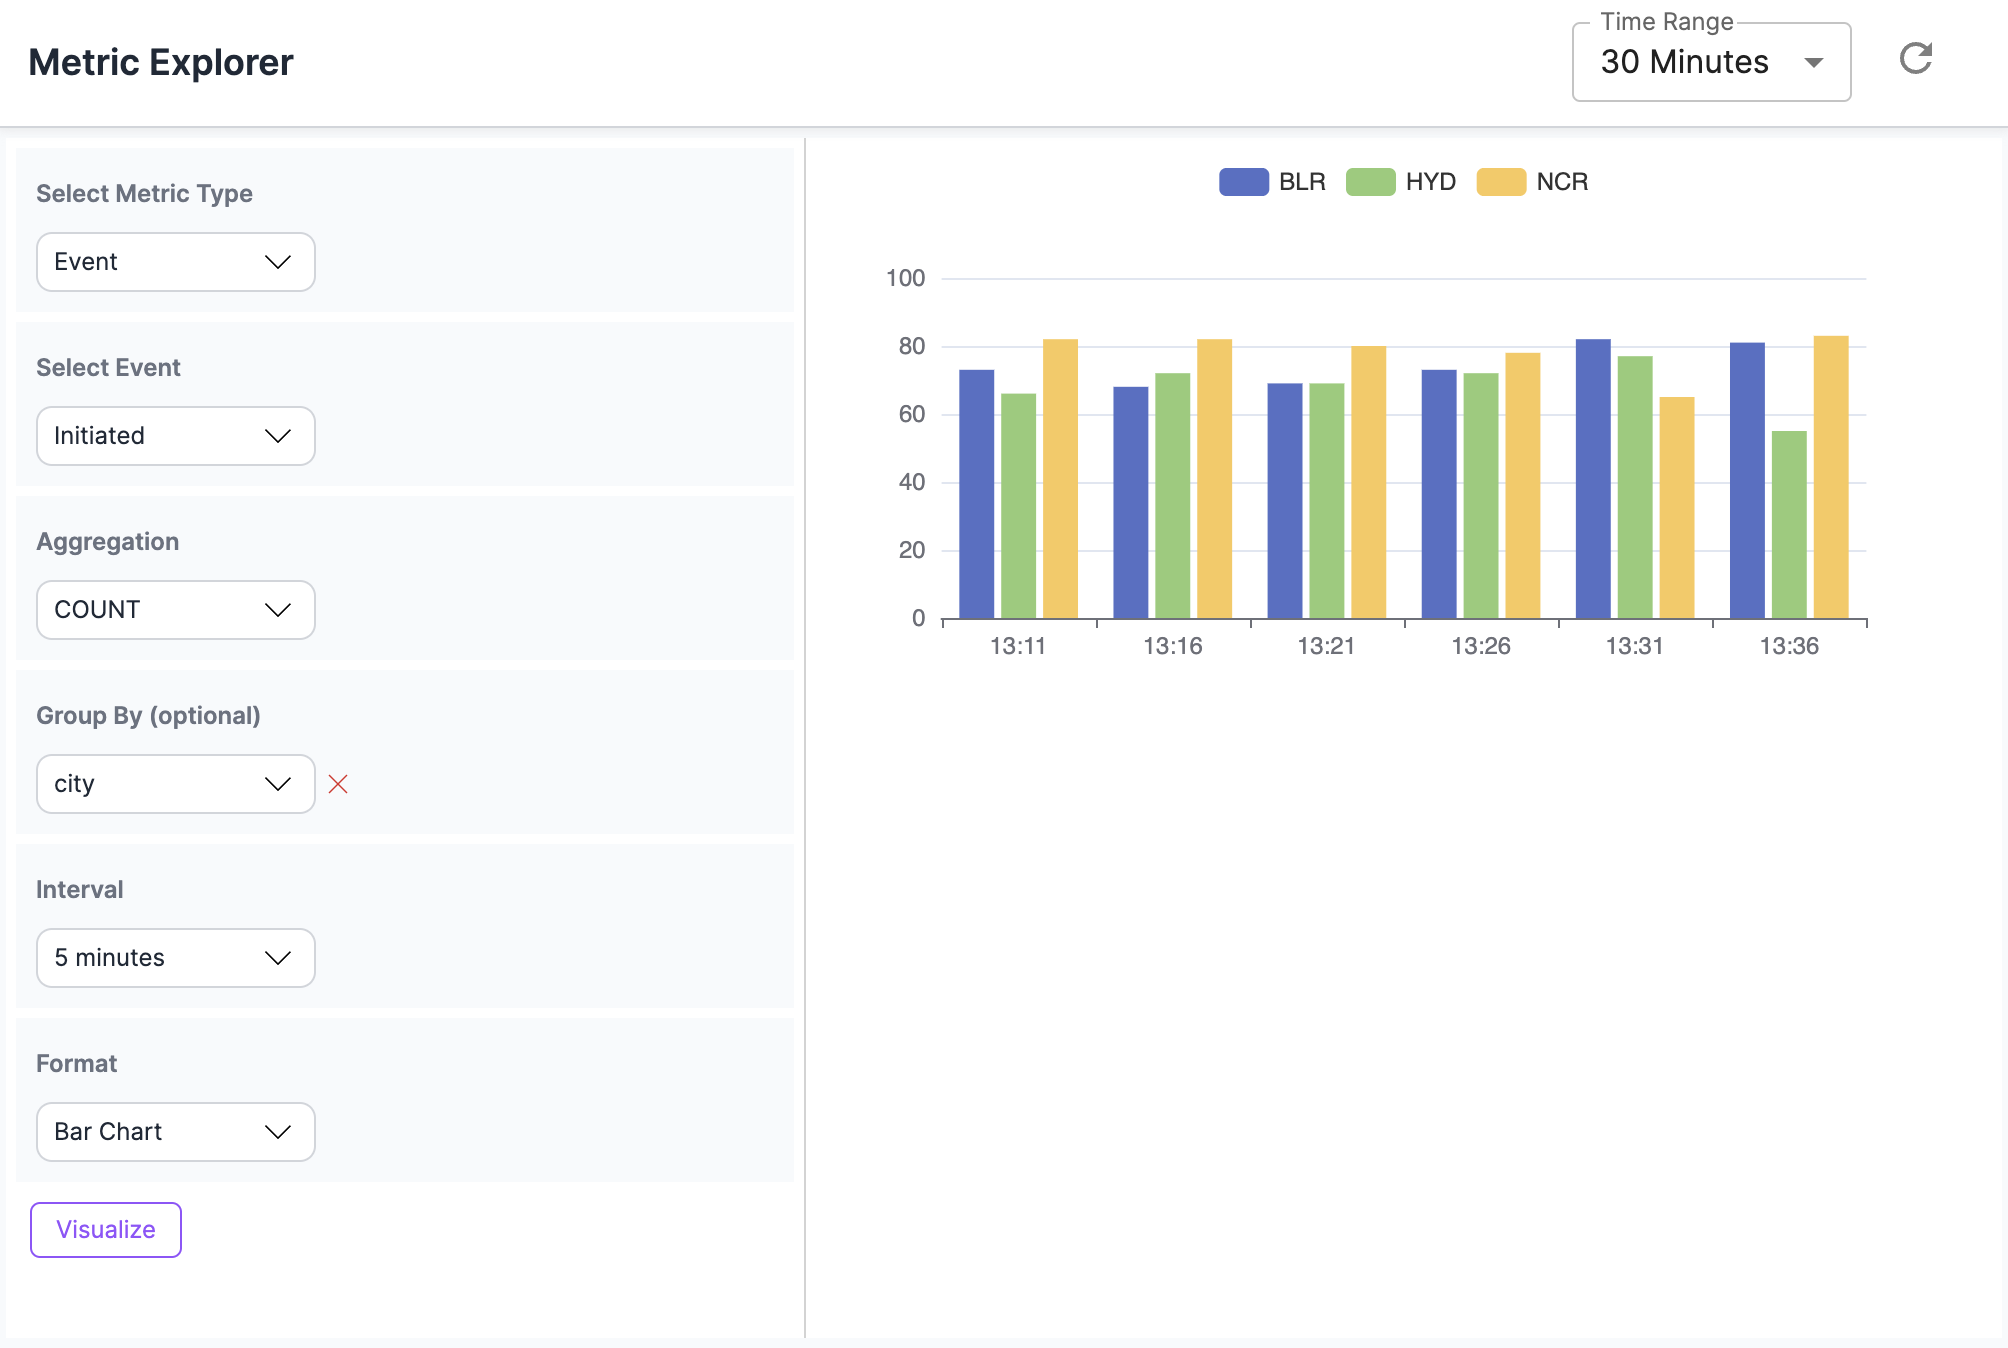
Additional Examples:
- This metric visualisation shows counts of orders on a city basis
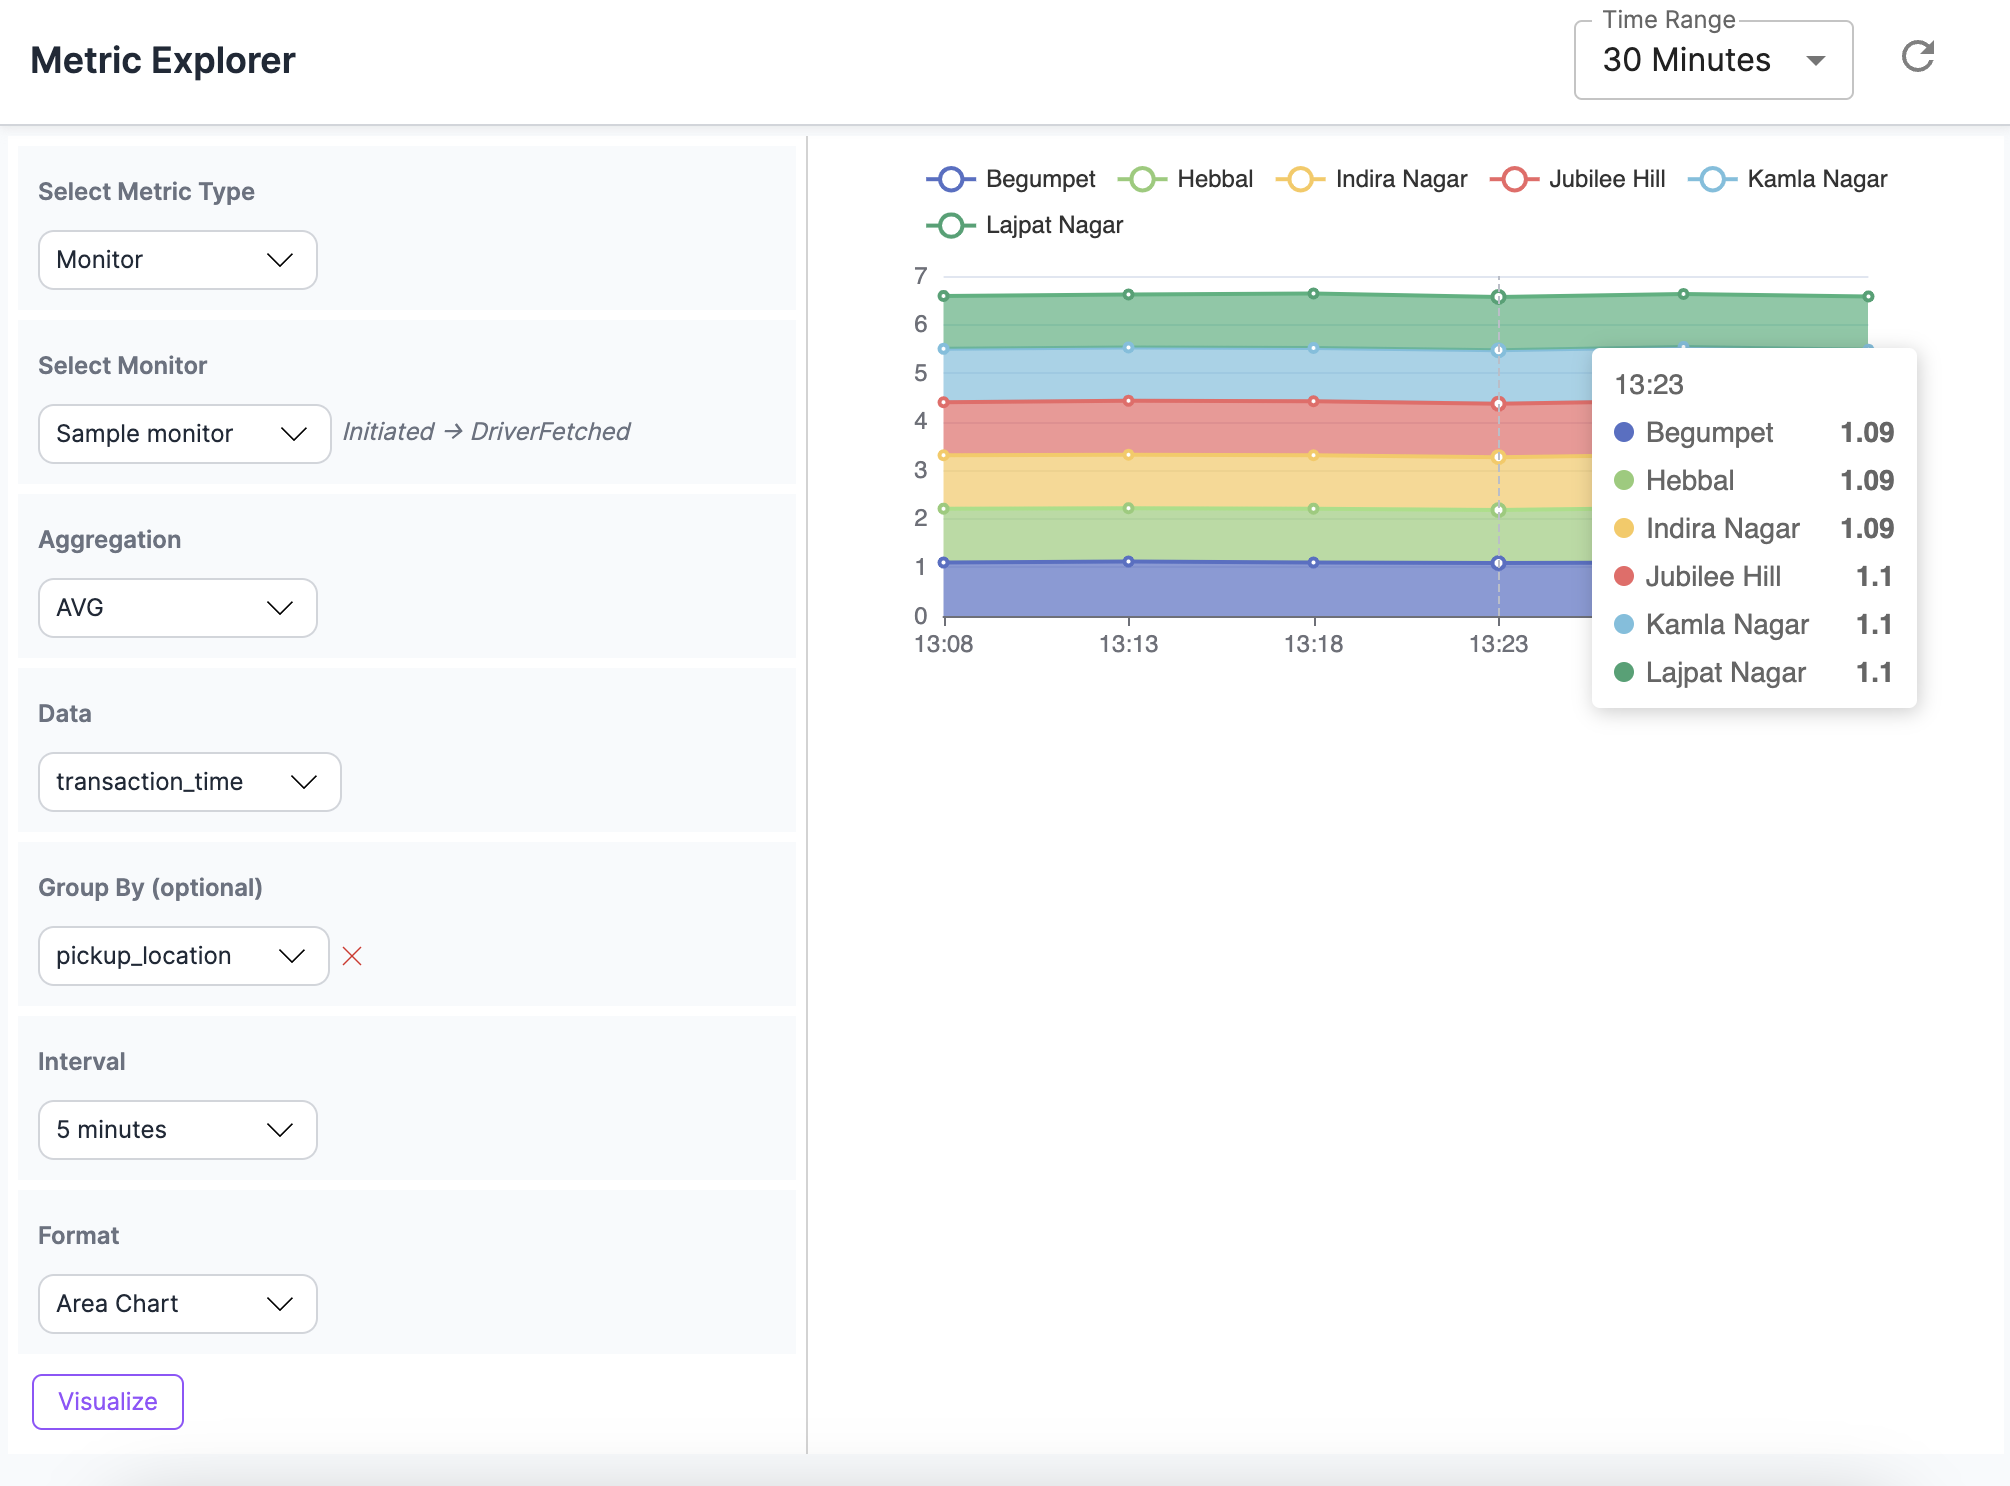
- This shows average time being taken by your allocation algorithm to find drivers based on the pickup area of the order
You can see this video or checkout the sandbox to understand more about this feature.
Updated 2 months ago